
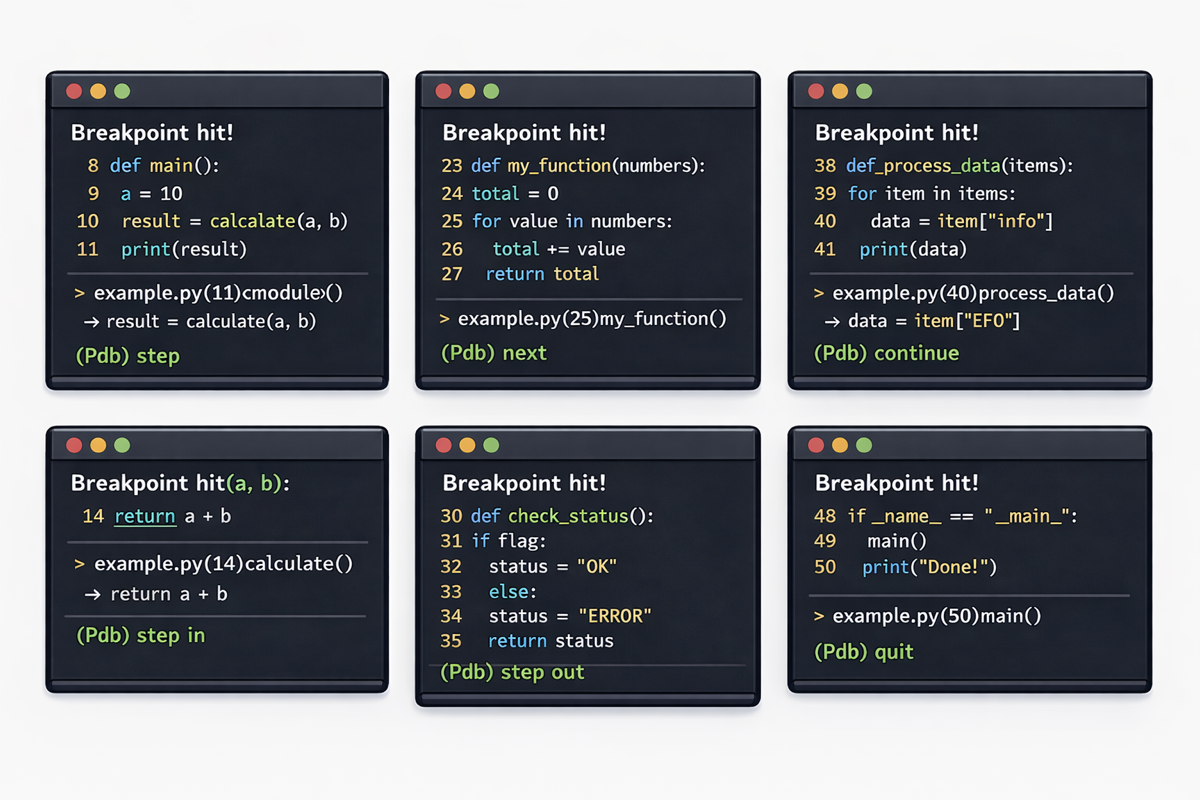
This is Part 1 of a three-part series on post-training a code model to use a real debugger. It covers the research question, the negative baseline result, the debugger harness, and the data pipeline. The next two posts will cover SFT and RL.
A few weeks ago I tweeted early results from this project and it got way more attention than I expected. This series is the full writeup, covering the negative baseline result that motivated training, the harness and data pipeline, and the SFT and RL runs that produced the final model.
The tweet below includes a demo showing the final trained behavior:
This series of blog posts covers the full project: a synthetic data pipeline, paired model evals, training a Qwen model with DoRA + GRPO to use a real debugger, and the work on reward shaping, NCCL weight transfers, training throughput, and training stability that made it work.
Part 1 covers three points:
- Debugger access should help most when the bug depends on runtime state.
- Tool access alone mostly does not teach models to use that state.
- If the missing piece is policy, the harness and data need to expose the right behavior and train on it.
Research Question
Current coding agents (Codex, Claude Code) work almost entirely through file edits, test runs, and print-debugging. Anthropic's Claude Opus 4.7 system card reports 80.5% on SWE-bench Multilingual1 using that toolset, without any access to interactive debugging.
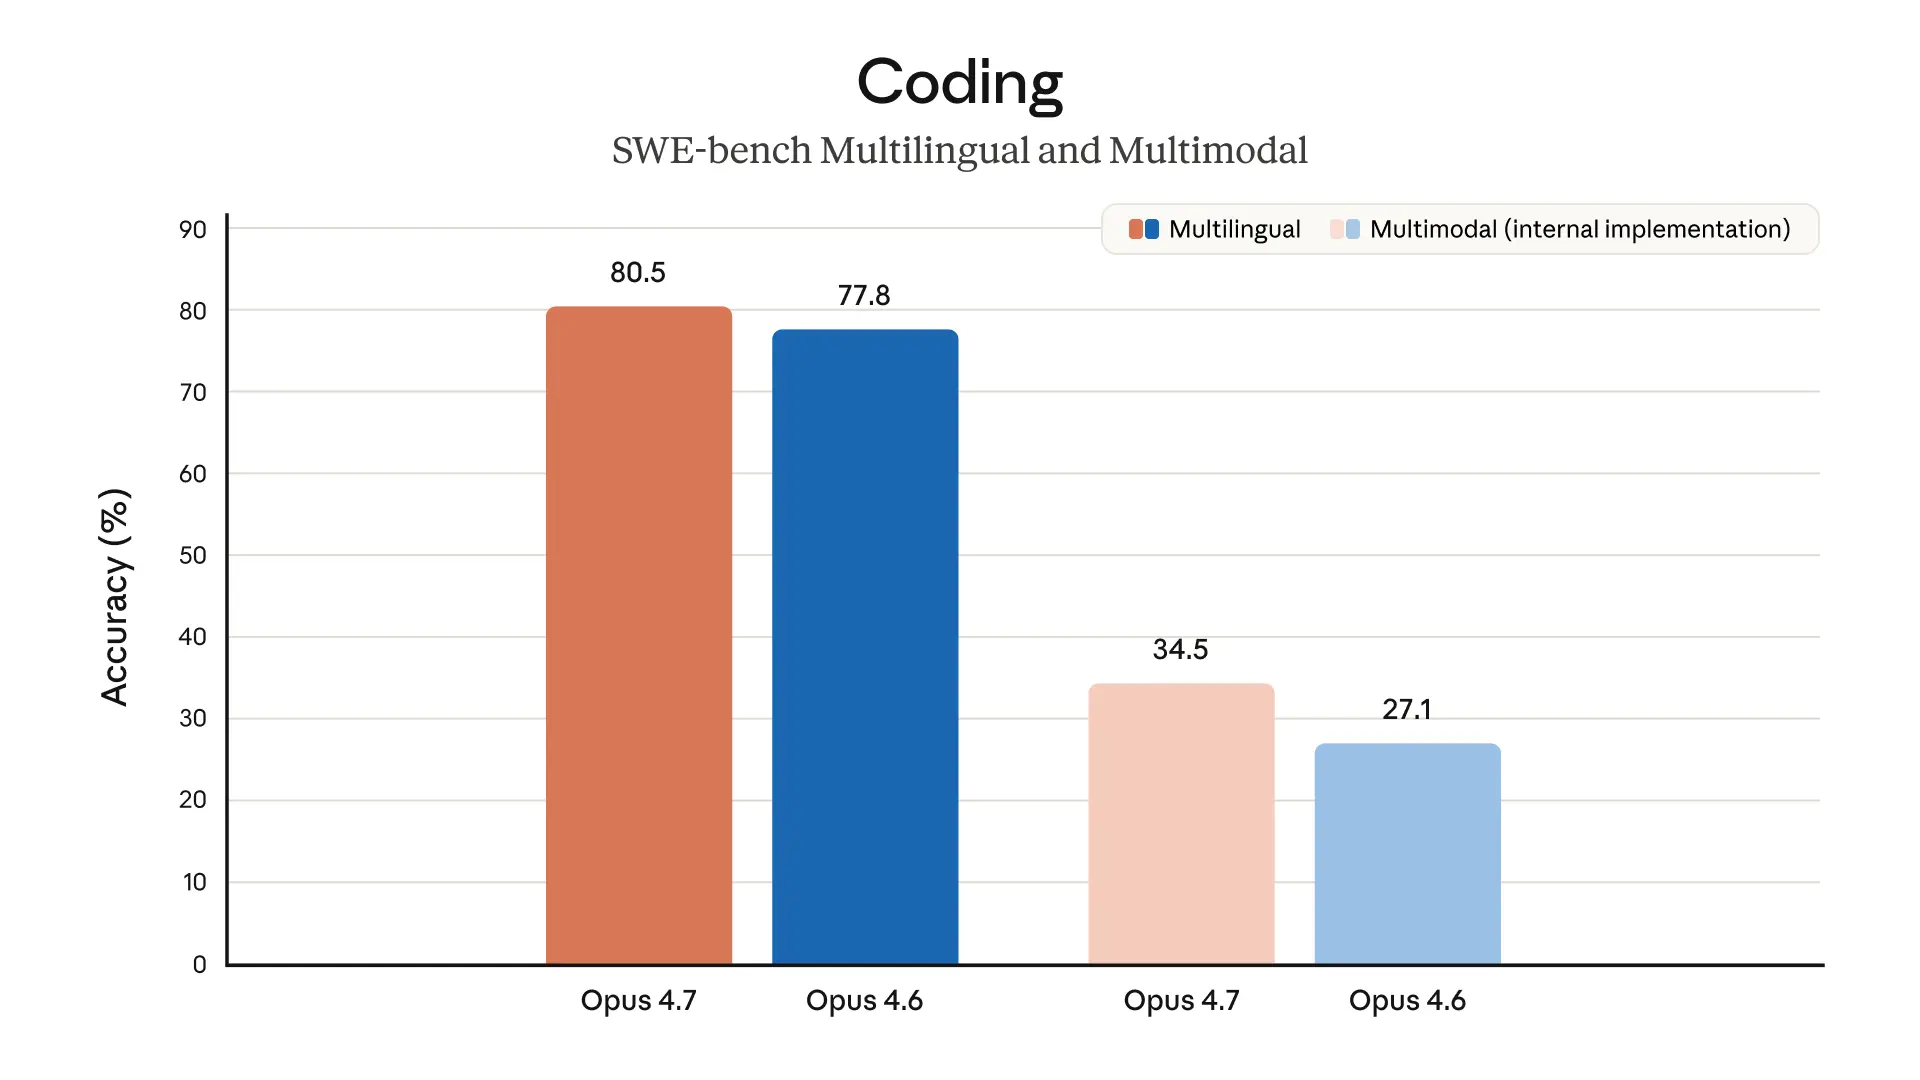
Figure 1: Claude Opus 4.7 performance on SWE-bench Multilingual. Source: Anthropic, "Introducing Claude Opus 4.7".
The distinction that matters is the kind of bug and how many turns the agent takes. Print-debugging works well when the model already knows which values to inspect before the program runs. It gets cumbersome when every follow-up question means modifying code, compiling, and reproducing the failure again. When the cause is obvious from the source and a failing test, that loop is fine. But when the answer is in the call stack, a frame-local value, or the first place an invariant breaks, pausing the program gives you the evidence directly.
This project targets that gap: giving the model a real debugger so it can pause at a concrete execution point, inspect the actual stack, locals, and control flow, and use that evidence to decide what to edit.
Debuggers matter most when the failure depends on dynamic state:
- an async deadlock,
- a value corrupted several transformations before the assertion,
- middleware that mutates a request,
- a recursive parser that breaks an invariant only at a deep frame.
In those cases, source text and failing assertions often identify the observed failure, but not the intermediate program state that caused it. Breakpoints, stack inspection, and expression evaluation make that state observable.
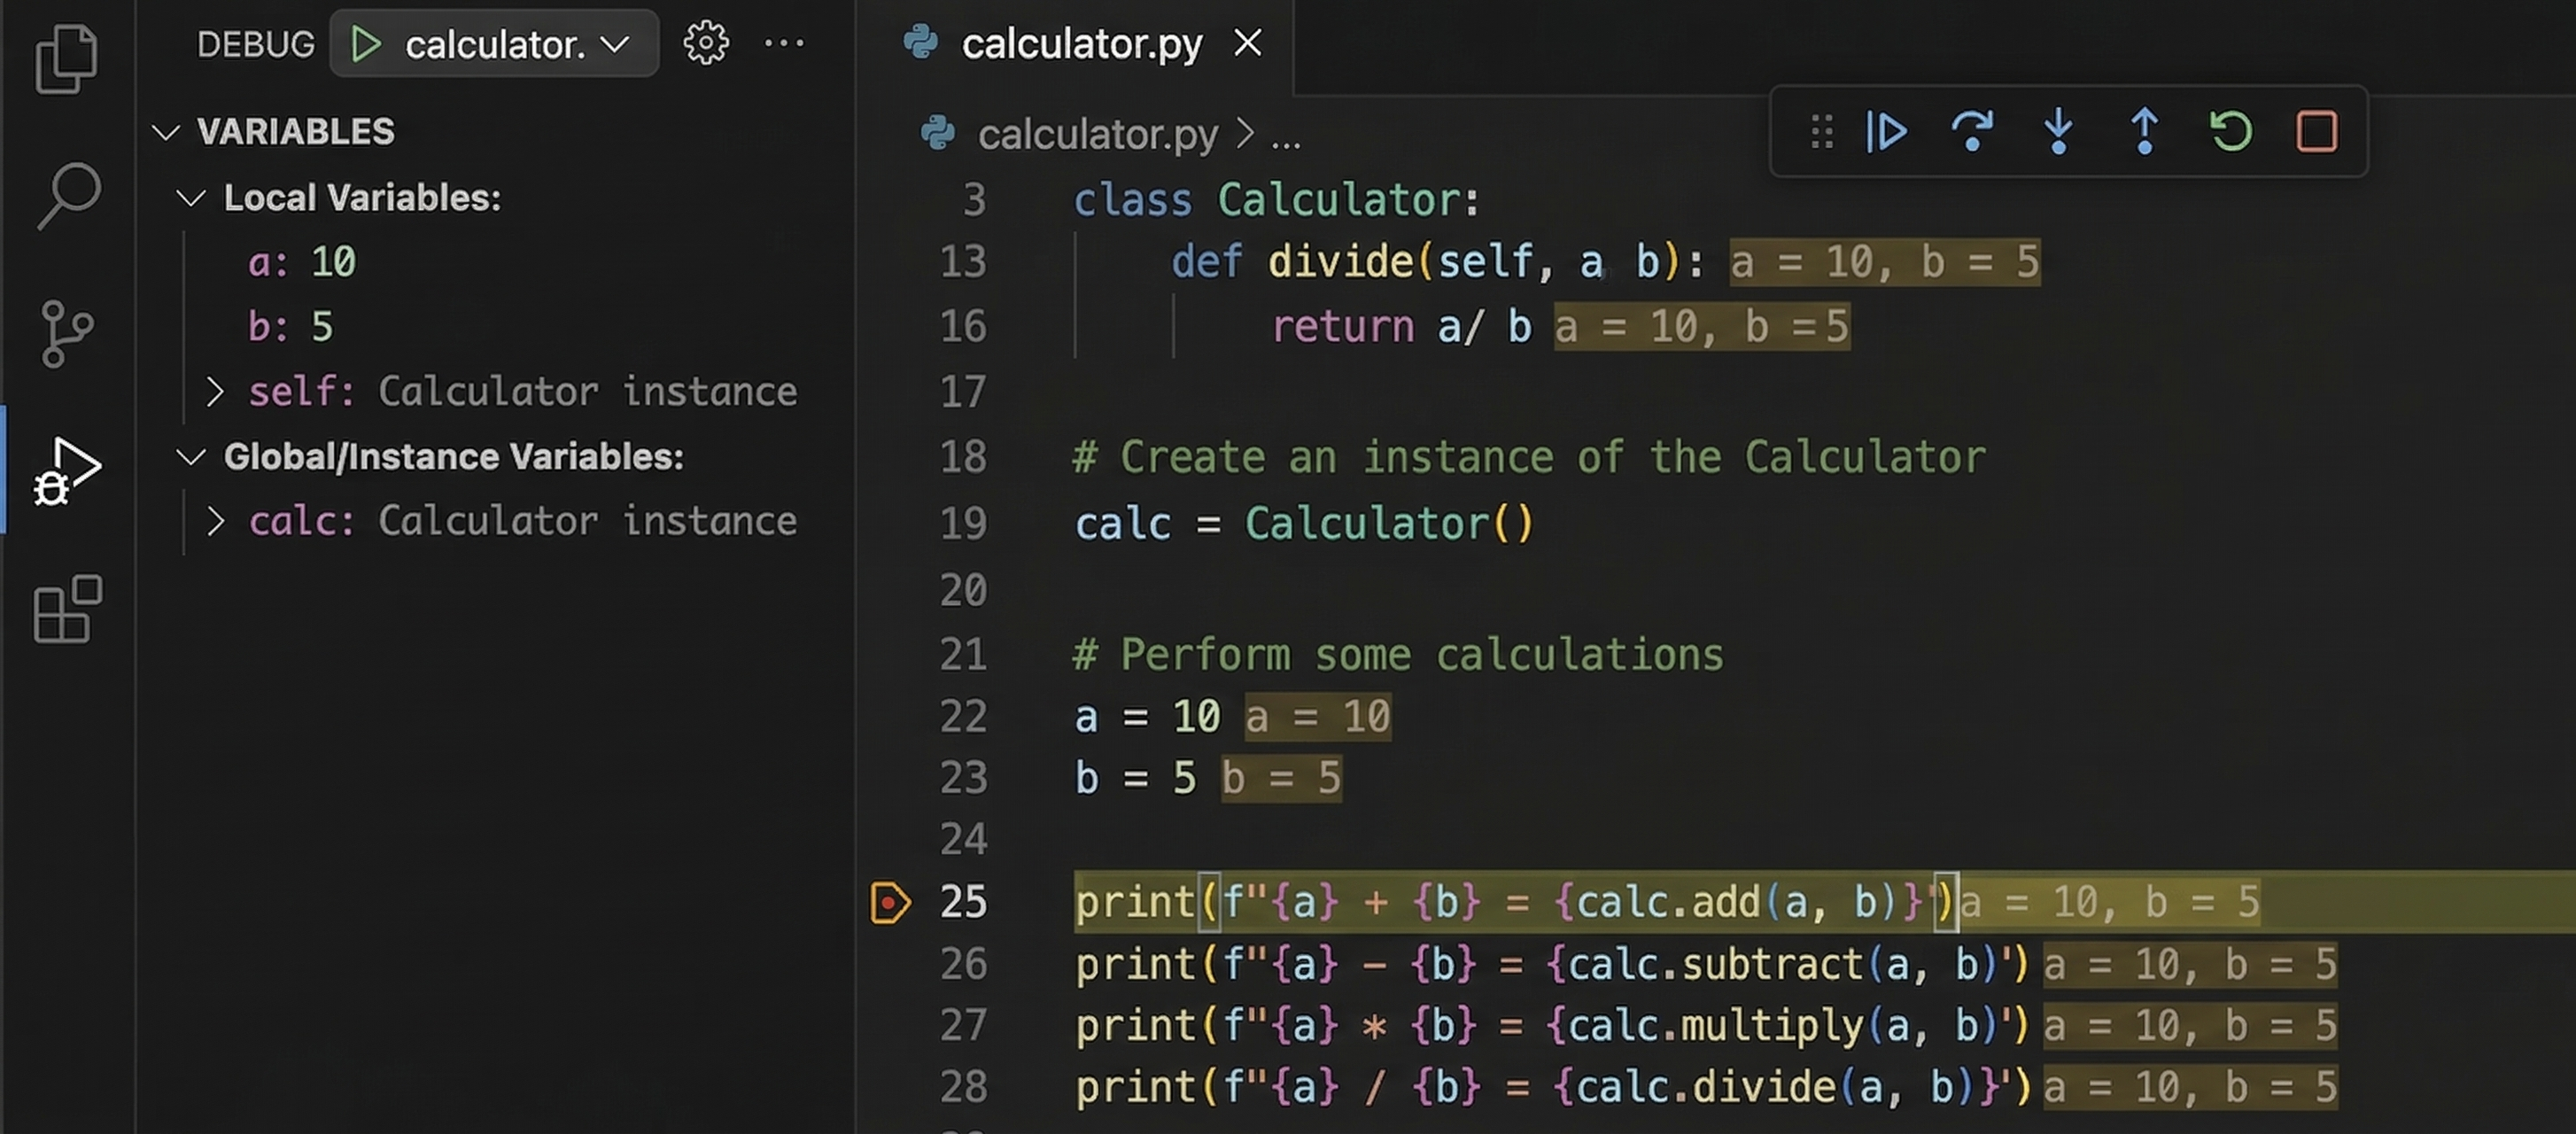
Figure 2: A debugger exposes runtime state directly: call frames, local variables, and the current execution point. Source: ChatGPT Images 2.0.
Compared with print-debugging, a debugger gives the model a few capabilities that are difficult to approximate with source edits alone:
- Inspect the full stack: See the call stack and variables across frames instead of relying on incomplete print logs.
- Evaluate expressions and alter execution live: Test ideas, tweak state, and try alternative paths mid-run without rerunning/recompiling or modifying source.
- Catch exceptions at the source: Pause exactly where an error happens with full runtime context.
- Instrument third-party code: Step into library or framework paths when the failure depends on code outside the target module.
The goal was not to "make the model call start_debugger." What matters is whether the runtime inspection actually changed the diagnosis or the patch. If it didn't, the debugger calls aren't contributing to the fix.
Hypotheses
Two hypotheses going in:
- Solve more bugs overall: some failures are not source-reading problems; they become identifiable only after observing the concrete value, call path, or frame where an invariant first breaks.
- Reach the fix in fewer turns: a well-placed breakpoint should replace several rounds of speculative edits and test reruns, since the model sees actual execution state instead of guessing at it.
The final post-training results will come in Part 2/3. This post starts with the control experiment: does tool access alone help?
Prior Work
Two projects are closest to this one:
- debug-gym. Microsoft Research's debug-gym is the closest research environment.2 It provides text-based debugging infrastructure: agents get tools like pdb, bash, eval, grep, edit, and submit, and researchers can run them on repair benchmarks. I saw it when I started this project, but debug-gym is mostly a harness / benchmark / agent environment, not a trained debugging agent.
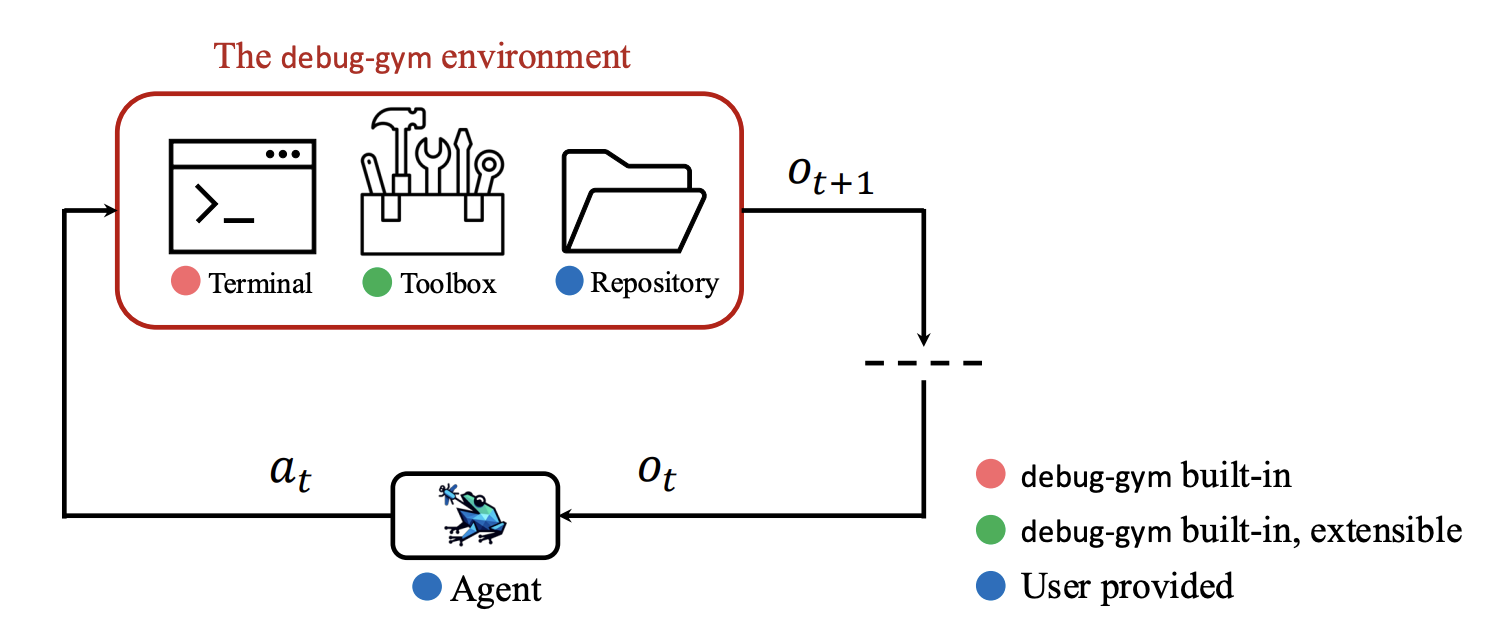
Figure 3: debug-gym's interactive debugging setup connects an agent to a terminal, extensible tools, and a code repository. Each agent action changes the environment and returns a new observation. Source: debug-gym paper, Figure 2.
The baseline results below show the gap: tool access alone does not produce effective debugger behavior in our harness.
This project uses a debugger harness too, but the focus is on post-training. I built a separate harness because the training setup needed tight control over tool semantics, trajectory logging, and verification.
- Cursor's Debug Mode. Cursor's Debug Mode is the closest product.3
Cursor's Debug Mode announcement and demo.
It structures a debugging loop around hypotheses, print-style instrumentation, user reproduction, and cleanup. Cursor's loop still relies heavily on the human to reproduce bugs, validate fixes, and provide environment feedback. That is a different setup from training an autonomous policy inside a sandbox.
The three projects sit at different points along the same axis:
| This project | debug-gym | Cursor Debug Mode | |
|---|---|---|---|
| Interaction with code | Interactive pdb (breakpoints, frames, live eval) | Interactive pdb (similar tool surface) | Source instrumentation (print, log lines) |
| Policy | Trained (SFT + RL) | Untrained, prompting only | Untrained, prompting only |
| Autonomy | Fully autonomous inside a sandbox | Fully autonomous inside a sandbox | Human reproduces + validates fixes |
| Primary contribution | A trained debugger-using policy | A research benchmark + agent harness | A product UX wrapping a debugging loop |
The closest comparison is debug-gym, but the difference is focus: debug-gym is a benchmark and agent environment; this project asks whether post-training can make a model use those tools well enough to improve repair behavior.
Control Experiment: Tool Access Alone
Before training, I tested whether existing models improve when given additional debugging tools at inference. In this control, the only difference between arms was whether the model had the debugger tools in addition to the standard shell and file-editing tools, as well as the system prompt changes. I ran a paired A/B across Claude Sonnet 4.6, GPT-5.4, Kimi 2.6, and Qwen3-Coder-30B.
Each model saw the same 40 heldout tasks twice: once with the base toolset only, once with the base toolset plus debugger tools. The budget was 50 turns. The paired design matters because the tasks are heterogeneous; extra tool access helps only if it changes behavior on the same underlying repair problem.
For reference, this is the prompt diff between the without-debugger and with-debugger arms:
- You are an expert Python engineer. ONE tool call per response.You are an expert Python engineer. ONE tool call per response.
- Format: <tool_call>Format: <tool_call>
- {"name": "tool_name", "arguments": {...}}{"name": "tool_name", "arguments": {...}}
- </tool_call></tool_call>
- Tools:Tools:
- • bash: Shell commands (output capped — pipe through `head -n 50` or use `-m 50` with grep)• bash: Shell commands (output capped — pipe through `head -n 50` or use `-m 50` with grep)
- - Args: {"command": "..."}- Args: {"command": "..."}
- - Read files with `sed -n '1,150p' file` or a smaller window like `sed -n '40,120p'`- Read files with `sed -n '1,150p' file` or a smaller window like `sed -n '40,120p'`
- - If you don't know a file's size, check first with `wc -l file`- If you don't know a file's size, check first with `wc -l file`
- - Search with `grep -n -E -m 50 'pattern' file`- Search with `grep -n -E -m 50 'pattern' file`
- • edit_file: Replace exact text in a file• edit_file: Replace exact text in a file
- - Args: {"file_path": "path.py", "old_string": "...exact...", "new_string": "...replacement..."}- Args: {"file_path": "path.py", "old_string": "...exact...", "new_string": "...replacement..."}
- - Copy the exact snippet you want to replace from the file first- Copy the exact snippet you want to replace from the file first
- • write_file: Overwrite/create a file• write_file: Overwrite/create a file
- - Args: {"file_path": "path.py", "content": "...full file contents..."}- Args: {"file_path": "path.py", "content": "...full file contents..."}
- • start_debugger: Start a debug session
- - Args: {"file_path": "path.py"}
- • add_breakpoint: Set breakpoints
- - Args: {"breakpoints": [{"file": "path.py", "lines": [123, 150]}]}
- • continue_execution: Continue program execution (Args: {})
- • step_over, step_into, step_out, print_variable, examine_locals, inspect_stack, run_expression: Debug inspection
- • done: Finish the task. Call this as soon as you have made an edit and the tests pass.• done: Finish the task. Call this as soon as you have made an edit and the tests pass.
- - Args: {}- Args: {}
- - Don't call done before making at least one edit (edit_file or write_file).- Don't call done before making at least one edit (edit_file or write_file).
- - Verify with `pytest -xvs <test_file>` before calling done.- Verify with `pytest -xvs <test_file>` before calling done.
- - If tests already pass, call done immediately.- If tests already pass, call done immediately.
- STATE Summary (create when info accumulates):STATE Summary (create when info accumulates):
- <STATE v1><STATE v1>
- facts: [key discoveries]facts: [key discoveries]
- decisions: [approach choices]decisions: [approach choices]
- pointers: [file:path sha1=X lines=[Y-Z]]pointers: [file:path sha1=X lines=[Y-Z]]
- todos: [remaining tasks]todos: [remaining tasks]
- </STATE></STATE>
- Increment version each update (v1→v2→v3).Increment version each update (v1→v2→v3).
- Reading large files:Reading large files:
- - Use `sed -n '<start>,<end>p' file` to read line ranges.- Use `sed -n '<start>,<end>p' file` to read line ranges.
- - If you see <TOOL_OUTPUT_TRUNCATED>, request a smaller window or a different section.- If you see <TOOL_OUTPUT_TRUNCATED>, request a smaller window or a different section.
Start by running `ls` to see the files in the working directory — don't assume filenames; the failing test is the file matching `*_test.py`. Read the failing test and the code it exercises to localize the bug. When the cause isn't clear from the source,Start by running `ls` to see the files in the working directory — don't assume filenames; the failing test is the file matching `*_test.py`. Read the failing test and the code it exercises to localize the bug. When the cause isn't clear from the source, use the debugger to inspect real runtime state: start_debugger on the test file, set a breakpoint at the suspect line, then examine_locals/print_variable.reproducewith`pytest-xvs<test_file>`andaddprintsorruntargetedsnippetstoinspecttherealruntimebehavior.- Efficiency: For small files, read in one pass with `sed -n '1,150p' file`.Efficiency: For small files, read in one pass with `sed -n '1,150p' file`.
- Use smaller windows only when the file is large.Use smaller windows only when the file is large.
- After editing code, verify with `pytest -xvs <test_file>`.After editing code, verify with `pytest -xvs <test_file>`.
- Only run tests after you have modified code. Do NOT modify test files.Only run tests after you have modified code. Do NOT modify test files.
- The goal is to FIX THE BUG and PASS TESTS, not just understand it. Be systematic and concise.The goal is to FIX THE BUG and PASS TESTS, not just understand it. Be systematic and concise.
Metrics
Across the baseline and post-trained evaluations, the project targets four questions:
- Does debugger access raise the solve rate?
- Conditional on success, does it reduce the number of turns to a fix?
- How often does the model invoke the debugger at all?
- When invoked, does the observed runtime state demonstrably inform the patch?
Questions 3 and 4 are tracked separately because invocation and effective use are distinct behaviors: a trajectory can contain start_debugger without any subsequent action being conditioned on its output.
Each evaluation runs a model on a heldout task set in one of two arms:
| Arm | Tools exposed |
|---|---|
| Shell, file reading, file editing, tests | |
| Base tools plus debugger tools |
A trajectory denotes the -th attempt by model on task in arm . An attempt is counted as successful only if the harness's independent verifier passes.
The primary outcome is solve rate. At attempts, a task is counted as solved if any of the attempts passes verification:
The primary contrast is debugger lift: the paired difference in pass@1 between the with-debugger and no-debugger arms on the same task set.
indicates that debugger access improved solve rate; indicates no improvement from tool exposure alone.
Turn cost is reported only over tasks solved in both arms, since the median is otherwise sensitive to which subset of tasks each arm happens to solve:
Two further metrics decompose debugger behavior into invocation and effective use: start rate and edit relevance.
Start rate measures invocation frequency: the fraction of with-debugger trajectories that open a debugger session at least once.
Edit relevance is a stricter conditional rate. Among trajectories that invoked the debugger, it measures the fraction in which an inspected runtime observation can be shown to have informed the subsequent edit.
is the set of observations from debugger inspection tools (examine_locals, print_variable, run_expression, etc.) in trajectory . An observation is used by the patch if it does at least one of:
- rules out a live hypothesis,
- identifies an incorrect runtime value,
- selects the failing frame or control-flow path,
- is explicitly reflected in the subsequent edit.
This criterion distinguishes effective debugger use from invocation alone. The trajectory analyses below apply it directly, asking whether runtime evidence caused the edit or whether the debugger session was incidental to a fix recoverable from source reading alone.
Solve Rate
Benchmark Preamble
The 40-task heldout set used here is a subset of a larger 182-task corpus of multi-file, state-dependent Python bugs with paired buggy/fixed implementations, a shared pytest suite, and human debugger-preference labels. The full dataset construction, including the task design, validation pipeline, and split methodology, is covered later in this post.
Every task is a bug fix, not feature work or a refactor. A debugger only helps when there is a concrete failure to trace back to a cause, and that is exactly what a bug fix gives you.
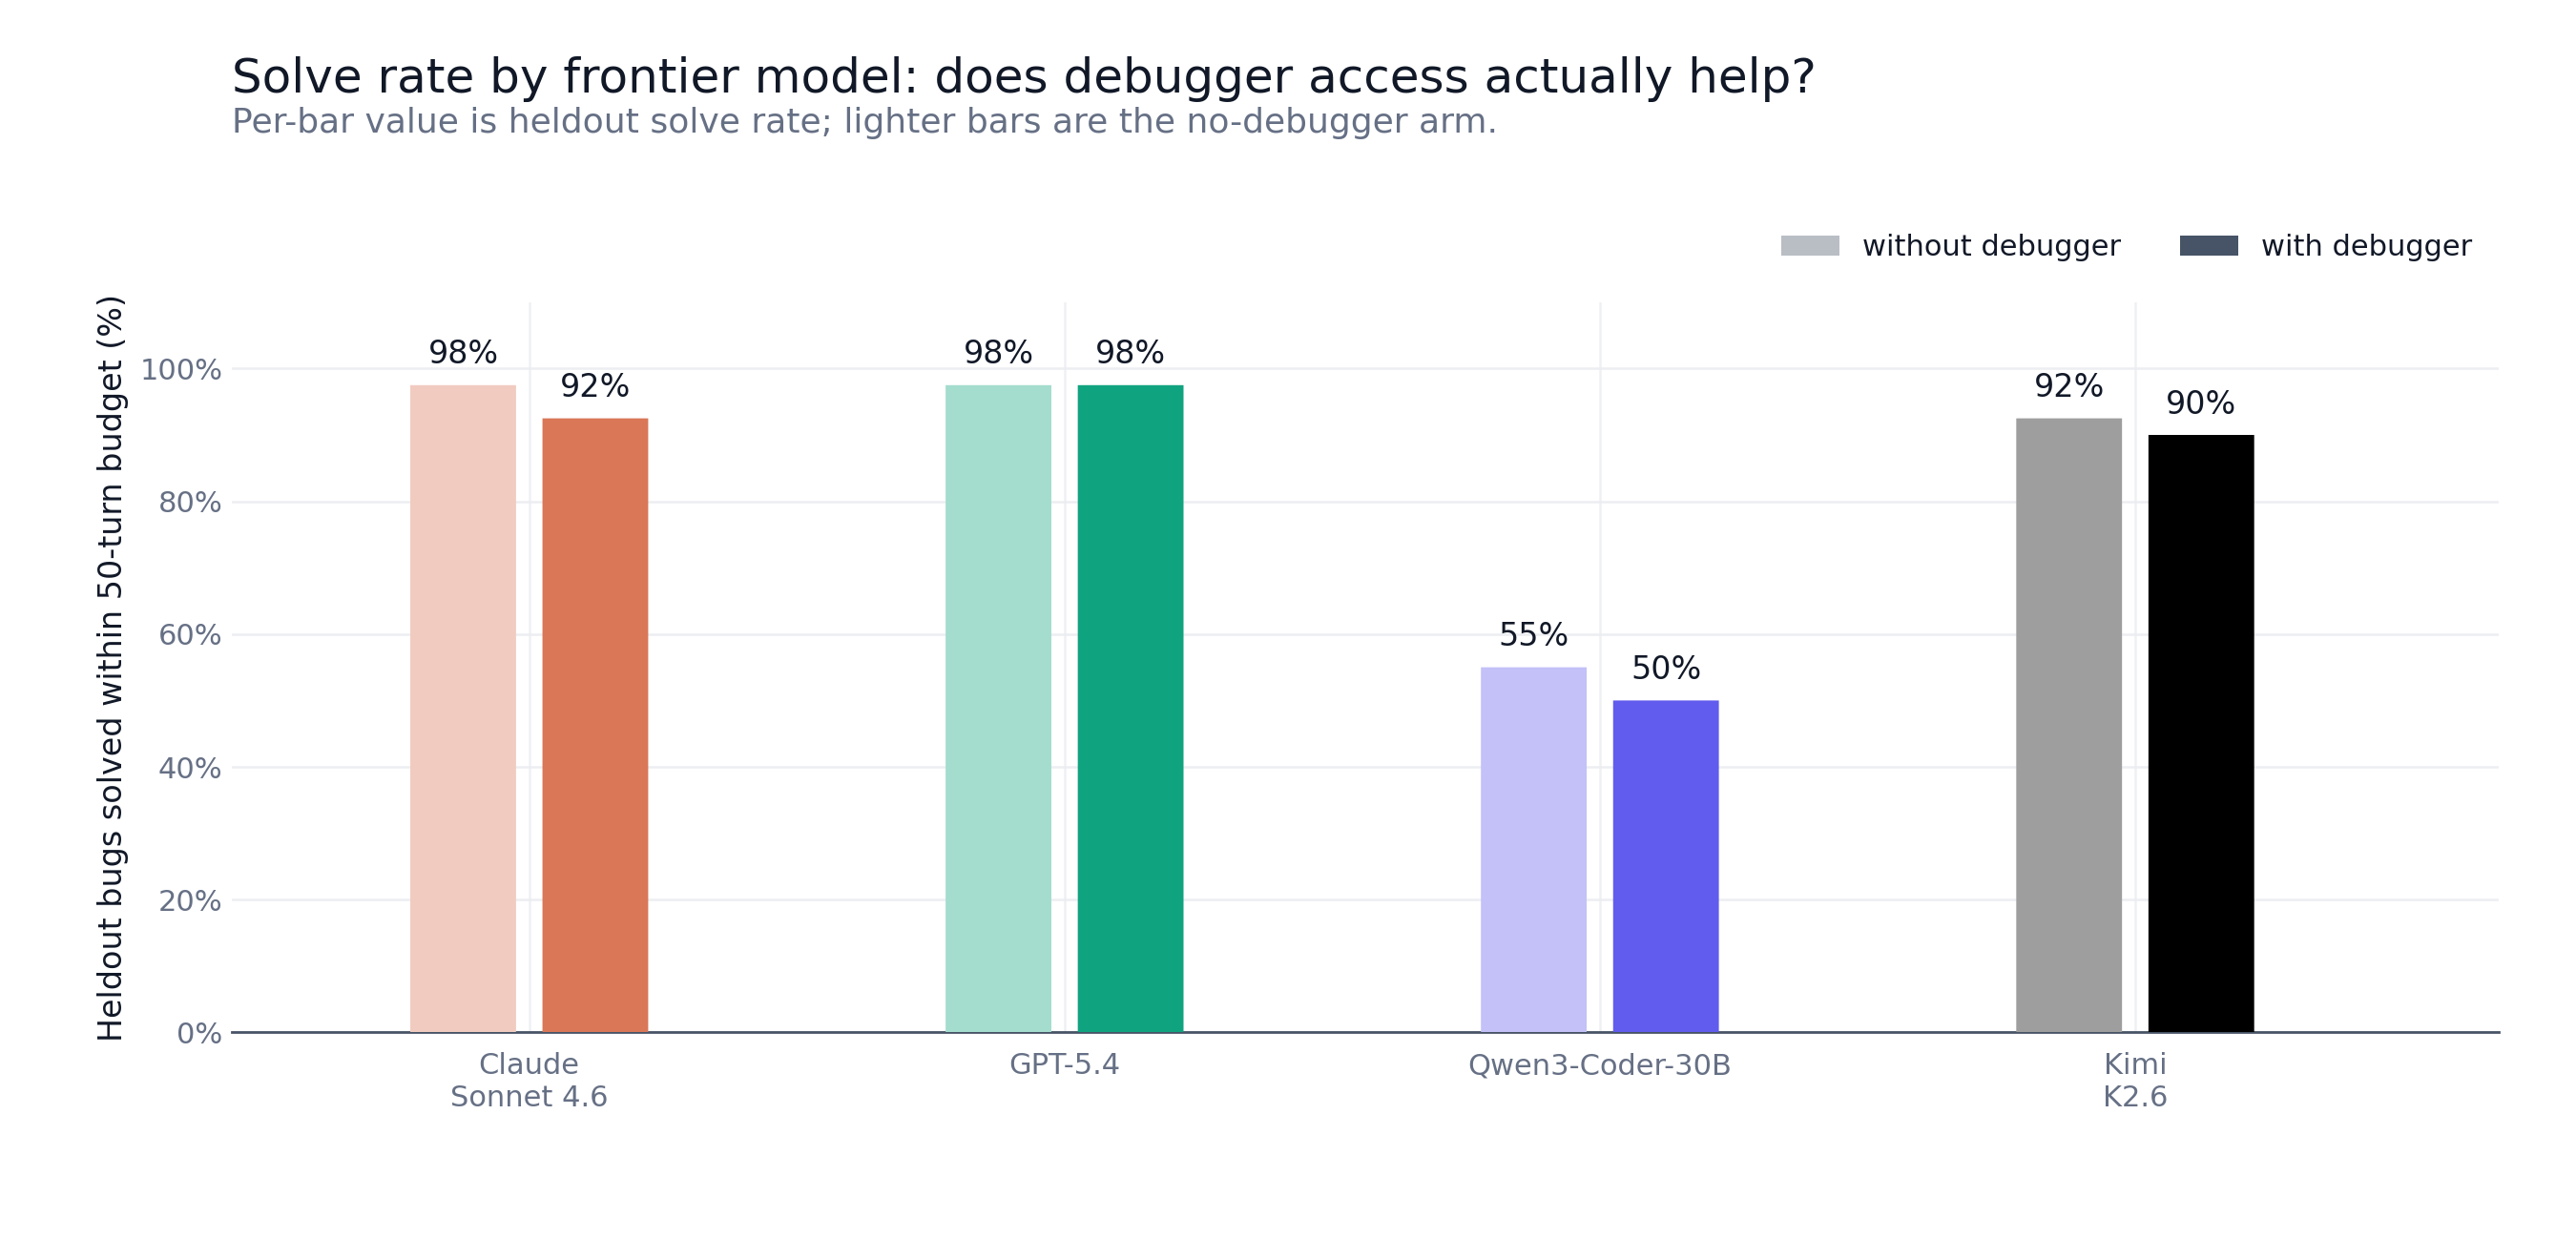
Figure 4: Per-model solve rate on 40 heldout bug tasks, with and without debugger access (Qwen averaged across 3 runs; frontier models, single run).
By every metric above, adding the debugger did not help any of the four models.
On this 40-task heldout set with this prompt, the with-debugger arm is, if anything, slightly worse. Claude, GPT, and Kimi are already very strong on these compact synthetic programs and have little headroom for the debugger to recover. Qwen3-Coder-30B is the relevant case, since it is the base model I planned to train against.
For Qwen3-Coder-30B, debugger access does not improve solve rate, and the few trajectories that invoke the debugger all fail.
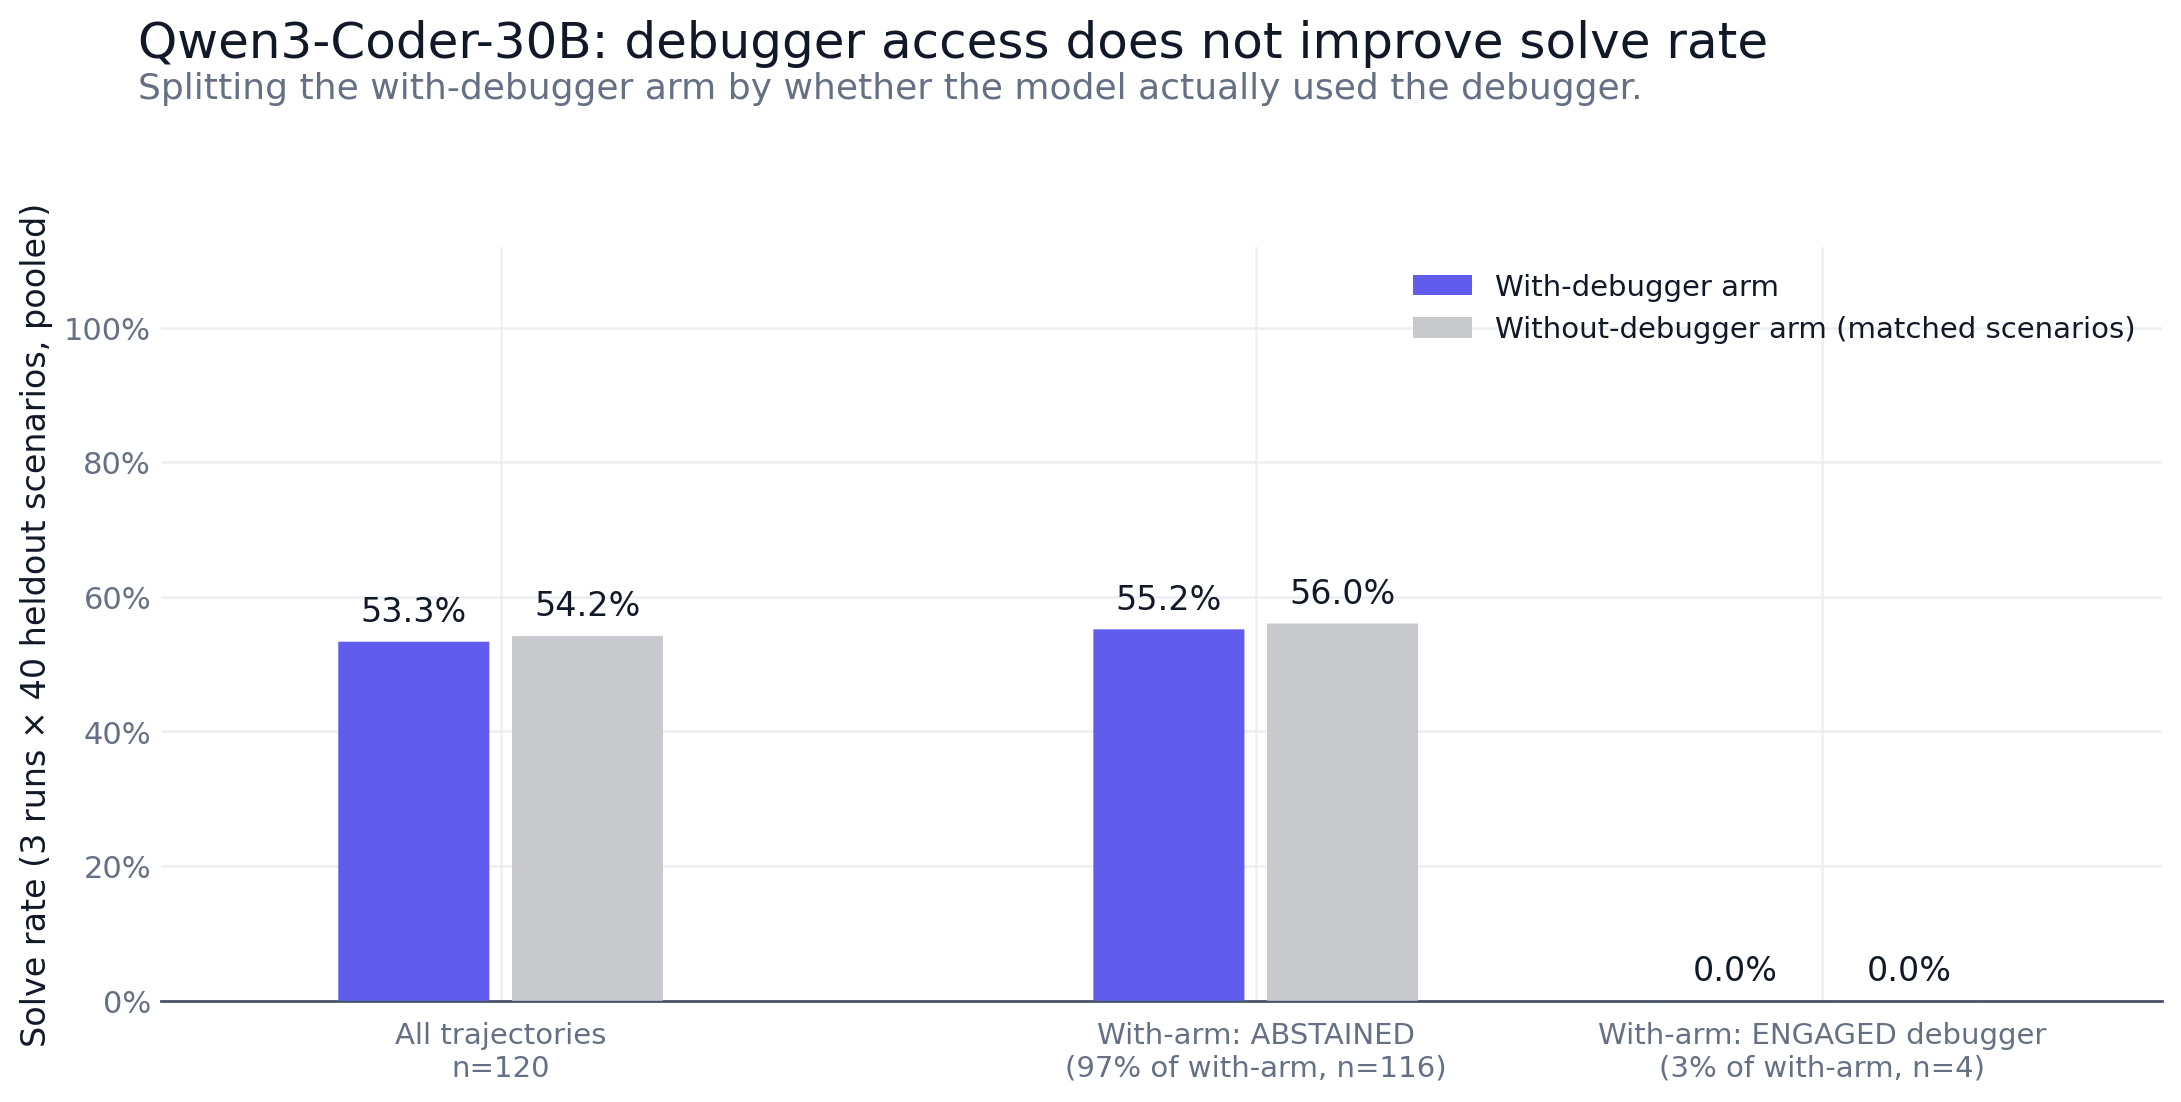
Figure 4b: Qwen3-Coder-30B with-debugger runs split by whether the model actually opened the debugger.
Across all 120 run/task attempts, vs , so .
Qwen opens the debugger in only 4/120 with-arm trajectories, and all four fail: and .Among the remaining 116 with-arm trajectories where Qwen never opens the debugger, pass@1 is 55.2%; the matched no-debugger attempts for those same run/task pairs are 56.0%.
Pass@1 by run, plus the mean over 3 runs:
| Qwen3-Coder-30B base | Run 1 | Run 2 | Run 3 | Mean |
|---|---|---|---|---|
| No debugger tools | 65.0% | 42.5% | 55.0% | 54.2% |
| With debugger tools | 57.5% | 50.0% | 52.5% | 53.3% |
With-debugger is numerically worse in two of three runs and in aggregate, despite large run-to-run variance on 40-task runs (one task is 2.5pp; no-debugger ranges 42.5%–65.0%, with-debugger 50.0%–57.5%).
Repeated-attempt coverage is the same: vs on the evaluator's success flag ( at ), and 77.5% vs 80.0% on the looser final-test-passed criterion.
No lift. Qwen almost never opens the debugger, and the four trajectories that do all fail.
That made Qwen the right target for training. Qwen3-Coder-30B was the base model for the rest of the project, and at roughly 54% pass@1 with a 50-turn budget, the task set still left room for improvement.
The top-tier closed models are close to saturated on these compact synthetic programs. A harder, larger-codebase benchmark would better separate Claude, GPT, and Kimi, but given limited time I stopped here once Qwen's low baseline confirmed there was enough headroom to evaluate post-training.
Turn Cost and Failure Modes
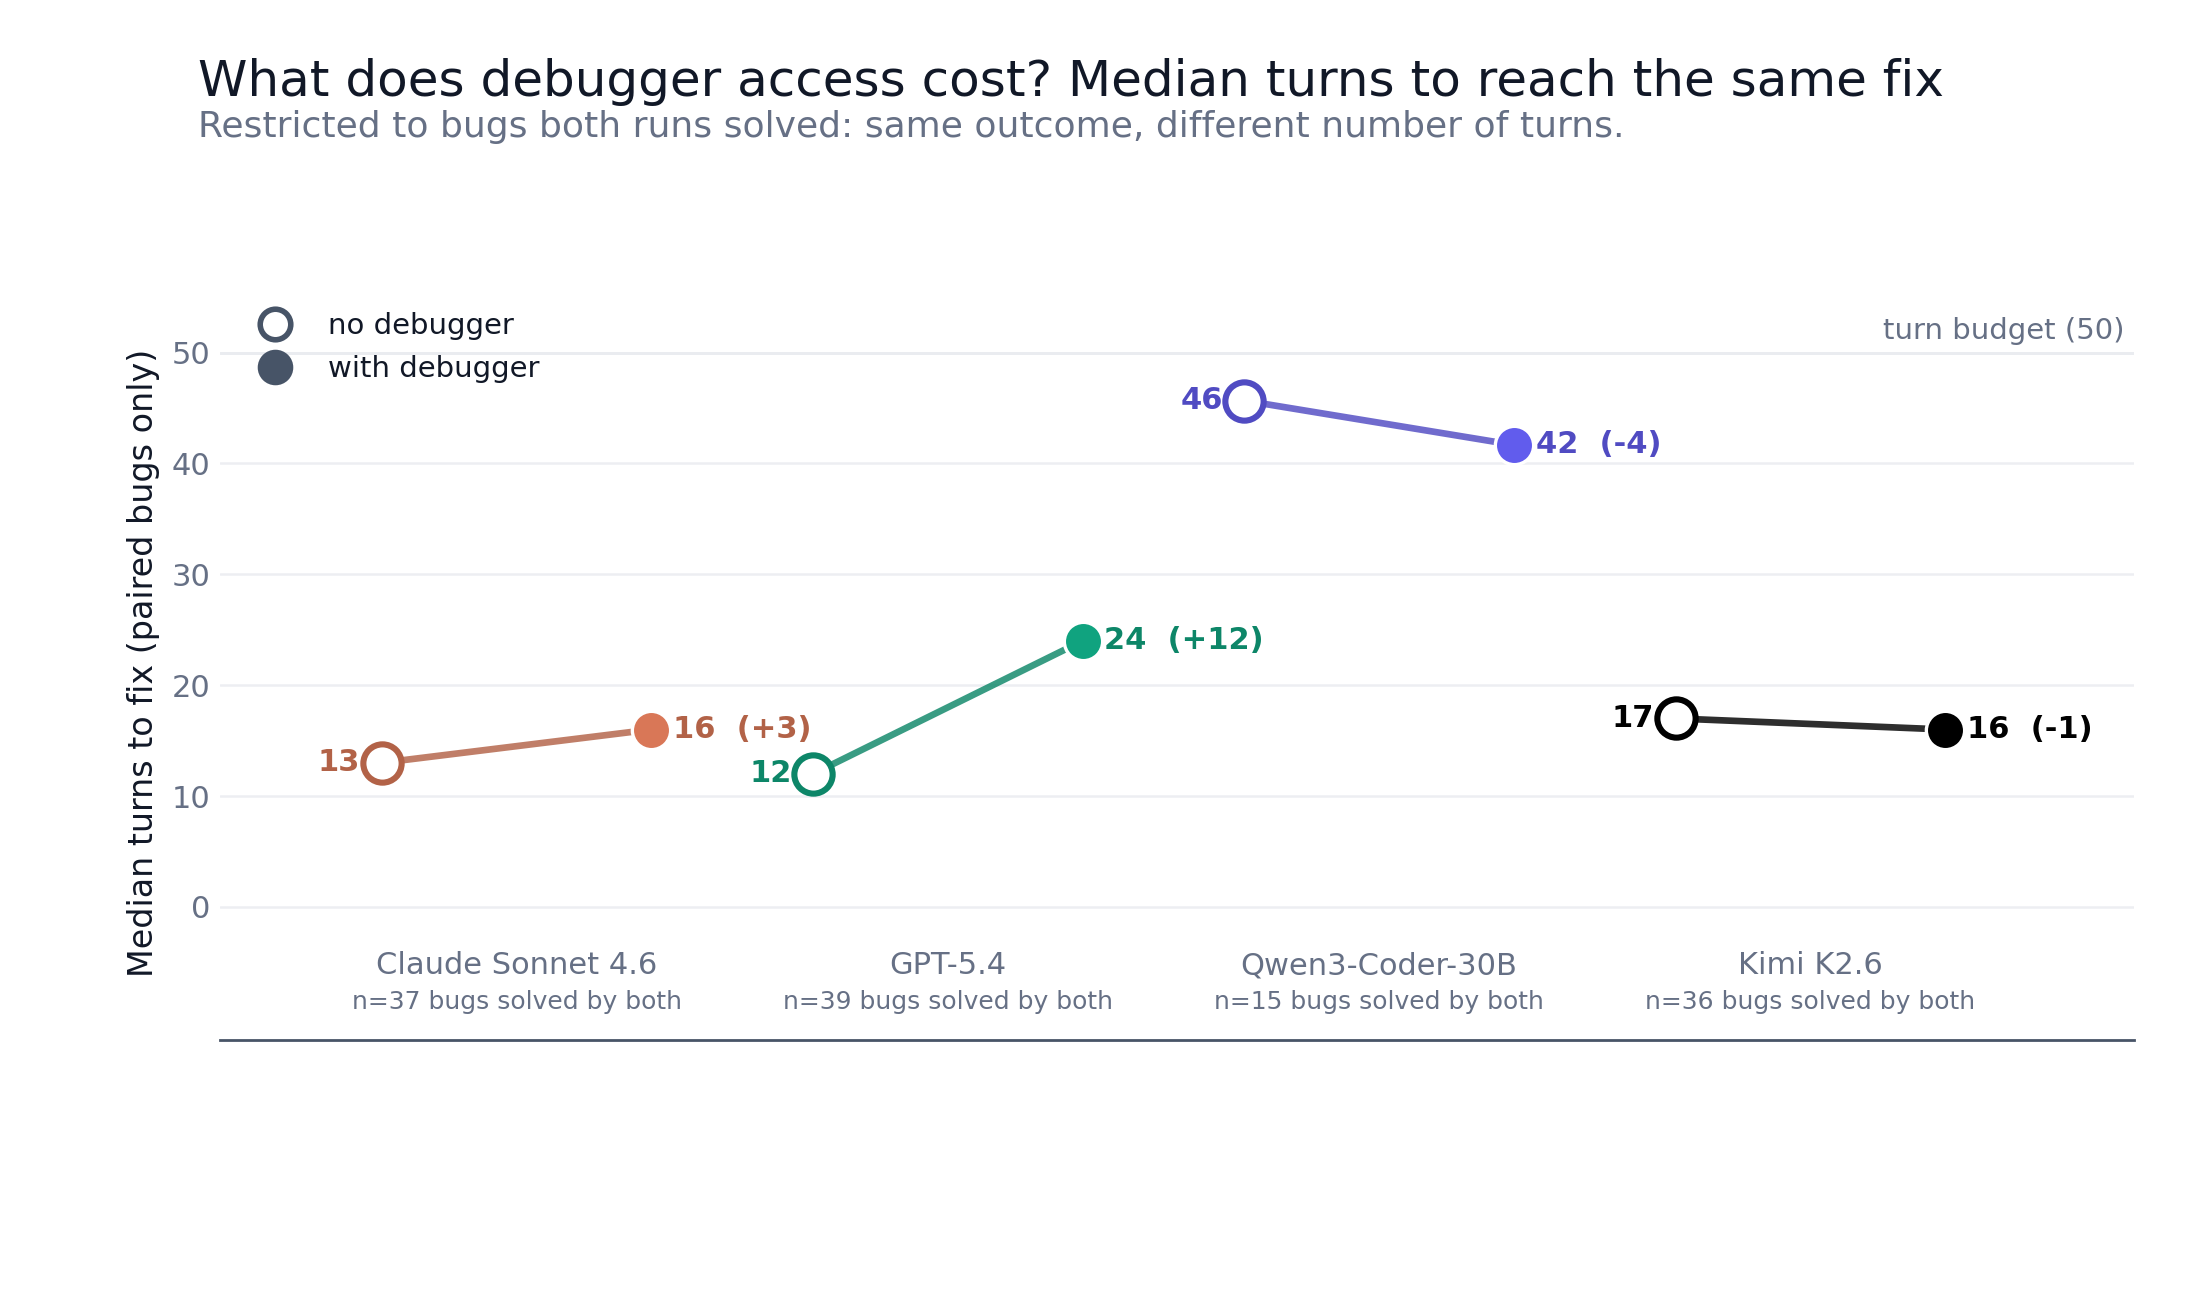
Figure 5: Median turns to fix on tasks solved in both paired conditions.
Restricted to (Qwen averaged across three runs before taking the median). When debugger access changed behavior, it added work rather than shortening the path to the fix.
GPT-5.4 is the clearest example: , with 6.5 debugger calls and 2.4 inspection calls per task on average, and on .
Claude, Kimi, and Qwen barely entered the debugger at all, so their small turn-count changes mostly reflect unchanged behavior. Qwen's drop looks favorable, but the with-debugger set has zero debugger starts after averaging; it remains on the read/edit/test path.
Across all four models, debugger access either did not change behavior or added tool calls without improving the diagnosis or patch.
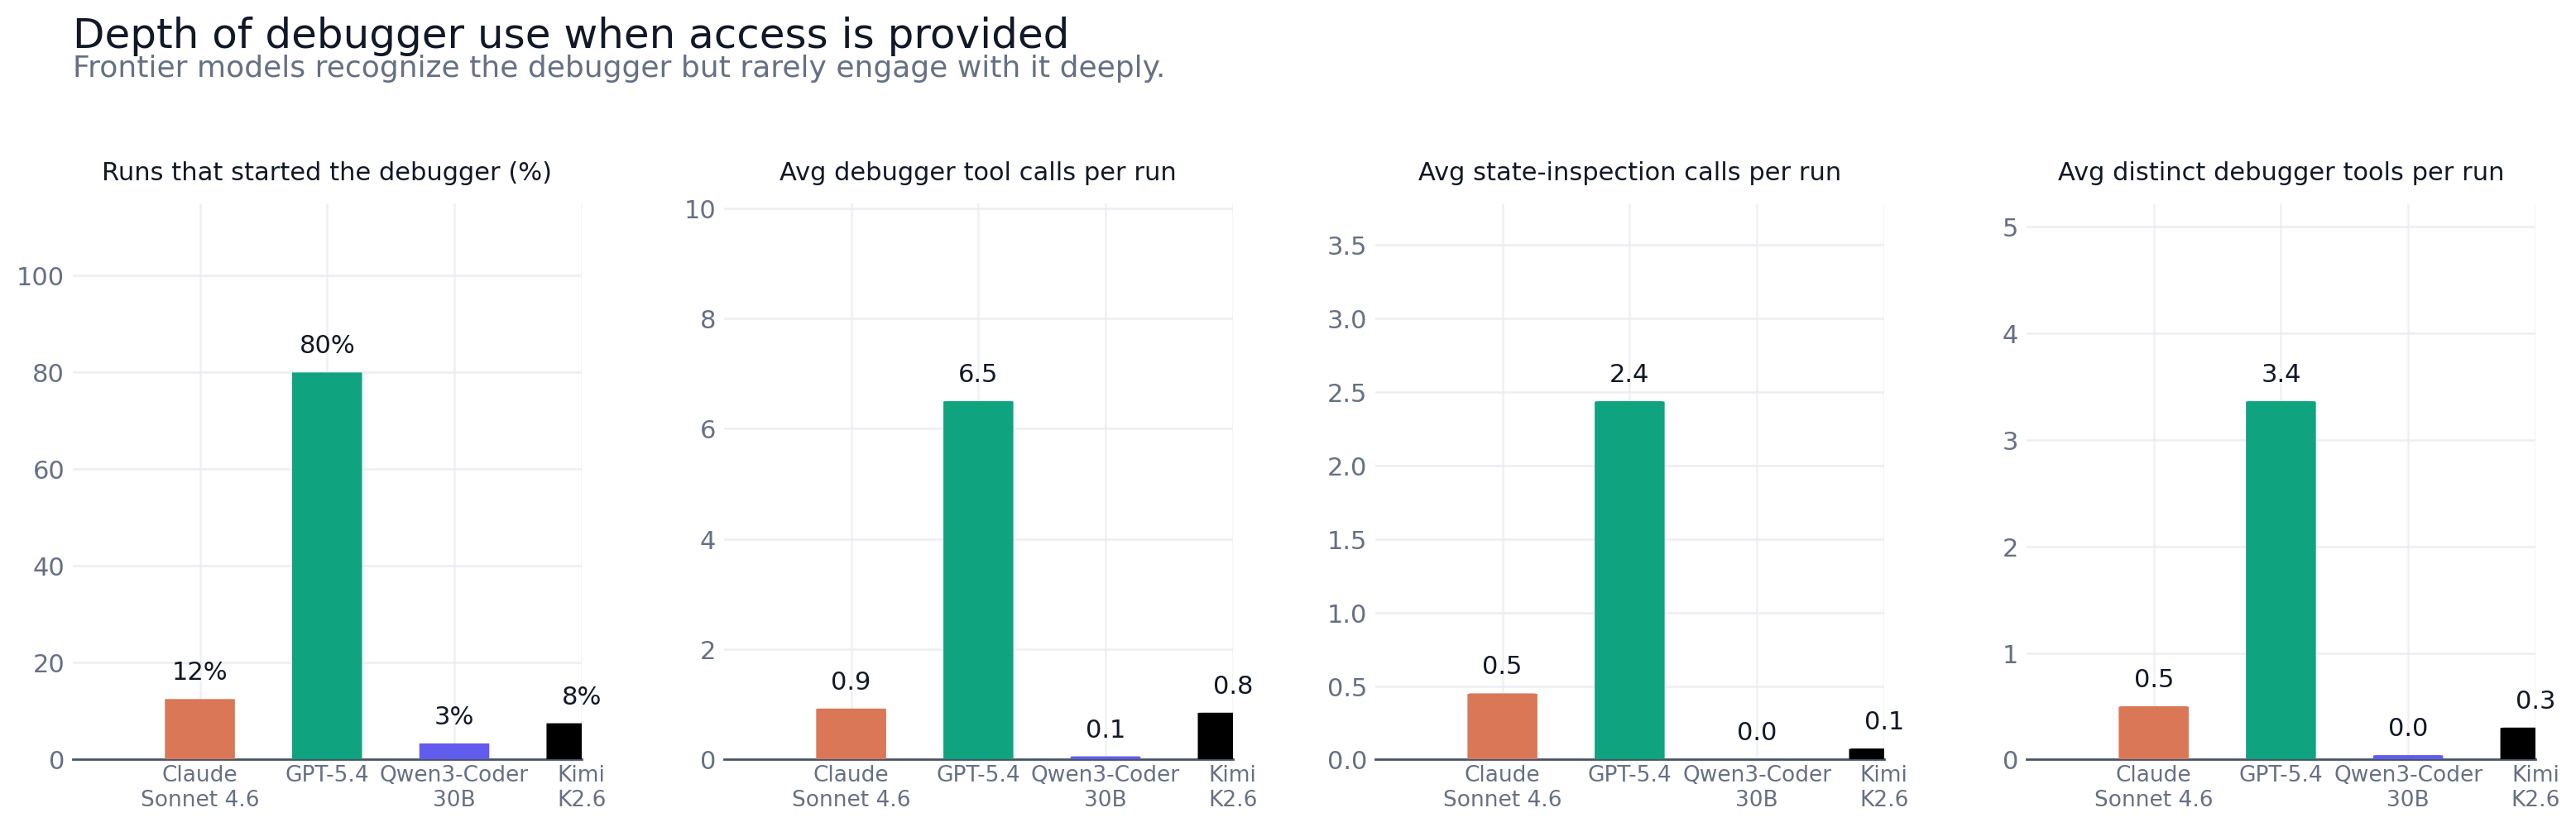
Figure 6: Debugger engagement depth by model.
Claude, Kimi, and Qwen3-Coder mostly abstain; GPT-5.4 enters the debugger often but shallowly. Per-model start rates in the with-debugger arm:
- (5/40)
- (3.0/40)
- (1.3/40)
- (32.0/40)
The edit-relevance rubric defined above is what GPT-5.4 fails: it sets broad breakpoints, steps around, inspects locals, then makes a patch that does not appear caused by anything it observed, so stays low despite a high . The model can call the tool but does not reliably condition its edit on what the tool returned.
What Failed in the Trajectories
The trajectories make the aggregate result easier to see. At this point the question is no longer "was the debugger called?" but "which observation, if any, caused the edit?"
The GPT-5.4 trace below is a representative case: the model opens the debugger, inspects state, then writes a patch that does not appear caused by any of that evidence; the test only passes after a fallback round of source reading.
arguments
breakpoints="[{\"file\": \"test_file.py\", \"lines\": [18, 31, 47, 61, 76, 90, 105, 119]}, {\"file\": \"buggy_module.py\", \"lines\": [4, 6, 8, 11, 13]}]"result
Line 18: Breakpoint set
Line 31: Breakpoint set
Line 47: Breakpoint set
Error: Cannot set breakpoint at line 61 in test_file.py because it is blank/comment-only. Pick an executable line (e.g., an assert or a function call). (PDB: b 61
*** Blank or comment)
Line 76: Breakpoint set
Line 90: Breakpoint set
Line 105: Breakpoint set
Error: Cannot set breakpoint at line 119 in test_file.py because it is blank/comment-only. Pick an executable line (e.g., an assert or a function call). (PDB: b 119
*** Blank or comment)
Line 4: Breakpoint set
Line 6: Breakpoint set
Line 8: Breakpoint set
Line 11: Breakpoint set
Error: Cannot set breakpoint at line 13 in buggy_module.py because it is blank/comment-only. Pick an executable line (e.g., an assert or a function call). (PDB: b buggy_module.py:13
*** Blank or comment)
Qwen3-Coder on a different task. It enters the debugger and inspects state at the recursive copy site, but the breakpoint fires during the passing test, not the failing one.
arguments
command="python -m pytest test_file.py -xvs"
result
FAILED test_file.py::test_deepcopy_cyclic_graph - RecursionError: maximum recursion depth exceeded
... [truncated]
When the patch turns out to be incomplete, the model never returns to the debugger to inspect the cyclic case. All four Qwen trajectories that opened the debugger look like this.
Exposing debugger tools expands the action space but does not, on its own, change the policy that selects and interprets actions.
Baseline Takeaway
The control experiment does not support either hypothesis for the off-the-shelf models tested here. None of the four converts debugger access into a reliable solve-rate gain, and the model most willing to use it (GPT-5.4) paid the largest turn-cost penalty. This points to a policy-learning problem rather than a pure tool-exposure problem: the models do not reliably know:
- when to enter the debugger,
- what to inspect once they are in it,
- how to let runtime evidence reshape the patch.
This motivates the approach taken in the rest of this project: using SFT and RL to train debugger use into the model's policy, rather than relying on tool exposure alone.
The Harness
The harness provides an isolated workspace, a persistent debugger session, a persistent shell, file edits, bounded observations, and an external verifier. A debugger session is stateful: breakpoints, the selected frame, the paused instruction, and the call stack persist across turns, and each tool call reads or mutates that state. This is the standard ReAct-style agent loop with an agent-computer interface.45 The interface exposes pdb's capabilities through a structured tool surface and normalizes its raw terminal output into observations the model can condition on.
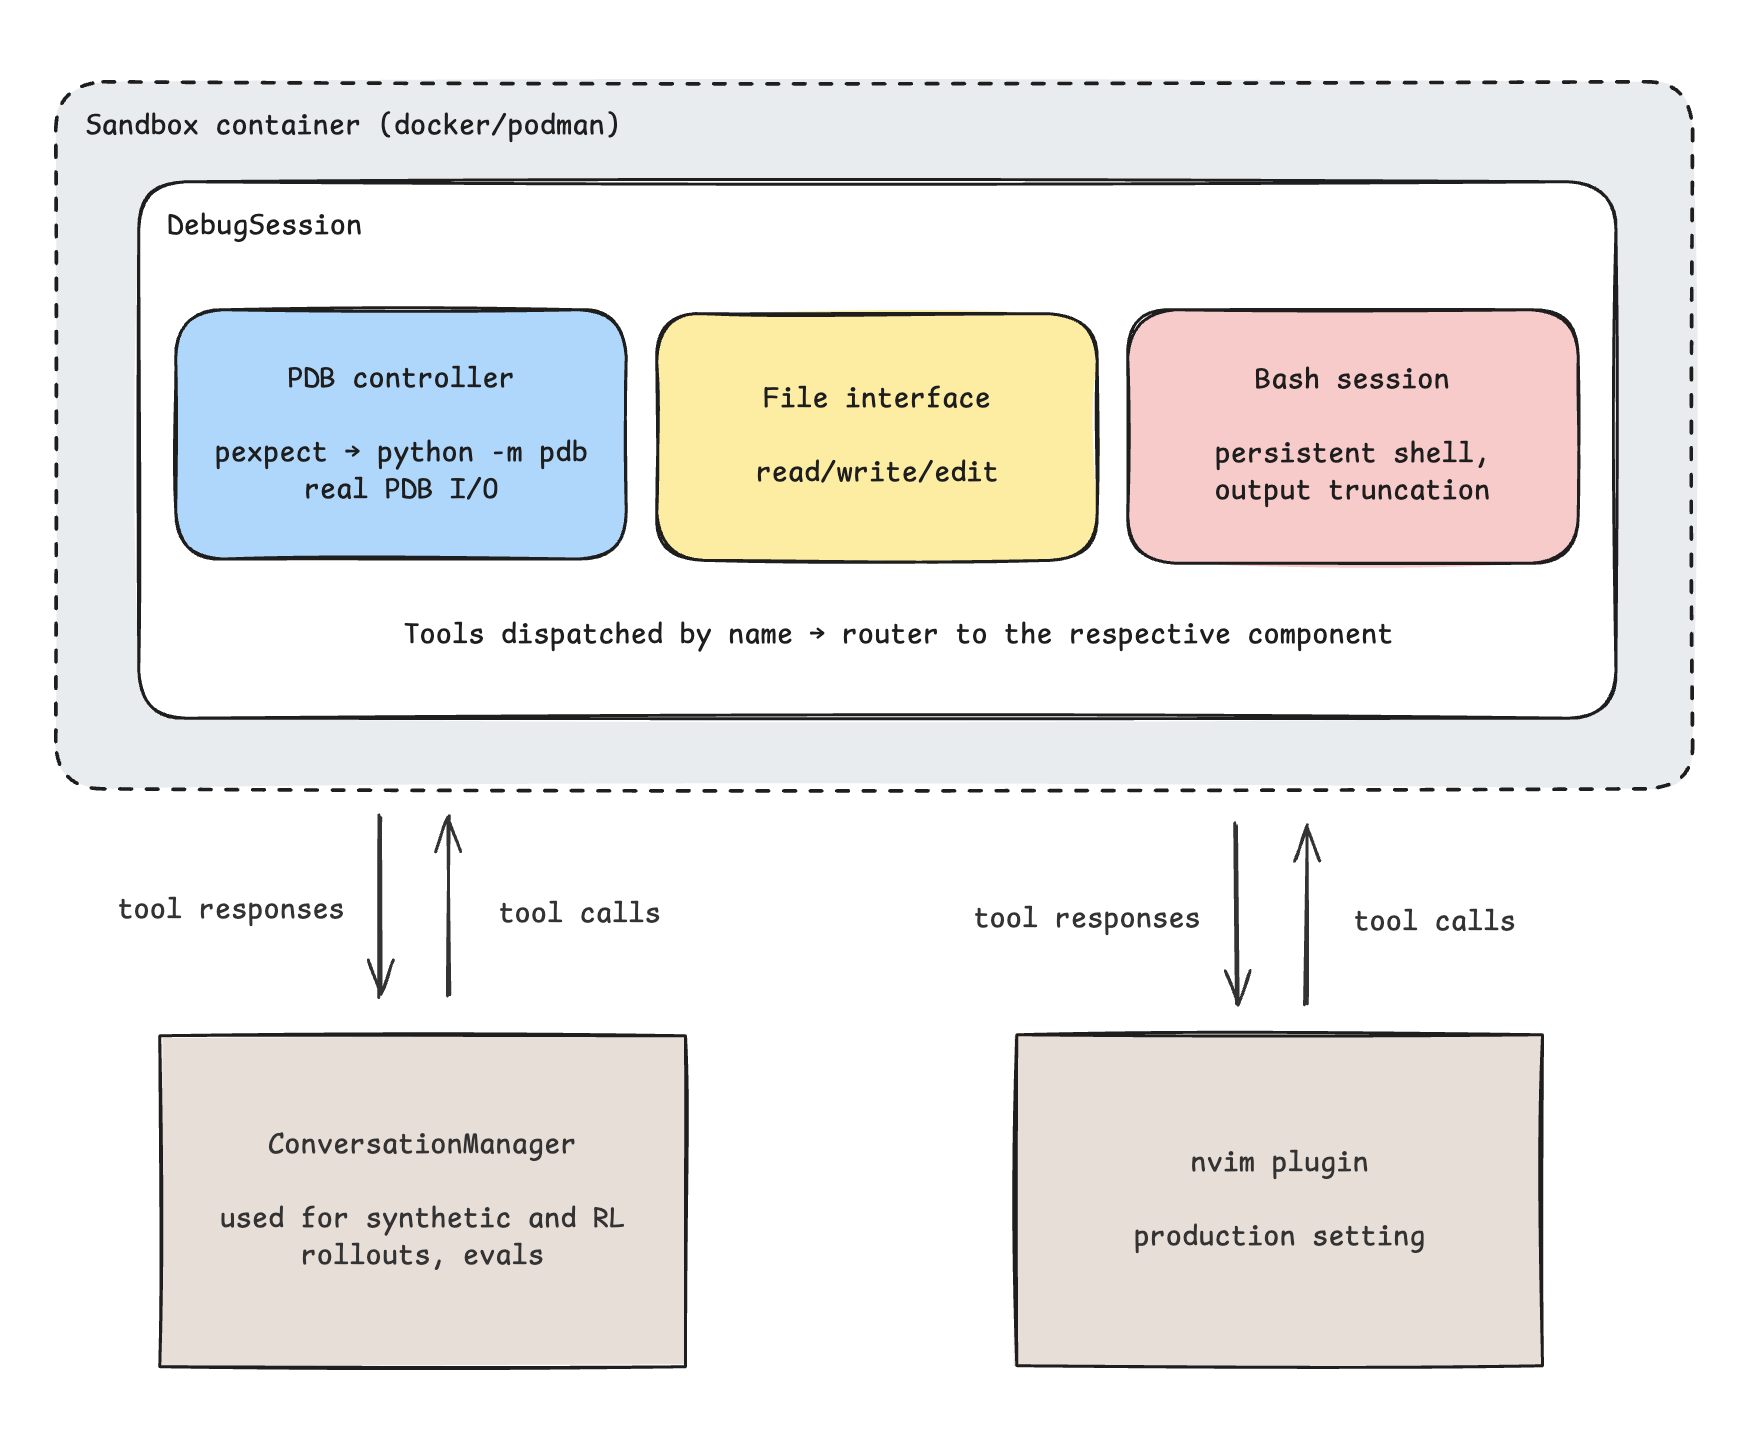
Figure 7: Each episode runs in an isolated sandbox. DebugSession routes tool calls to the debugger, shell, file interface, or control handler.
Episode Lifecycle
Each task is an episode. The evaluator materializes one task into a clean container workspace, starts a long-lived debug-service daemon inside that container, and then drives a normal multi-turn chat loop against the model.
At each turn, the model emits exactly one tool call. The daemon executes it, filters the result, appends both the assistant message and tool output to the trajectory, and sends the next observation back to the model.
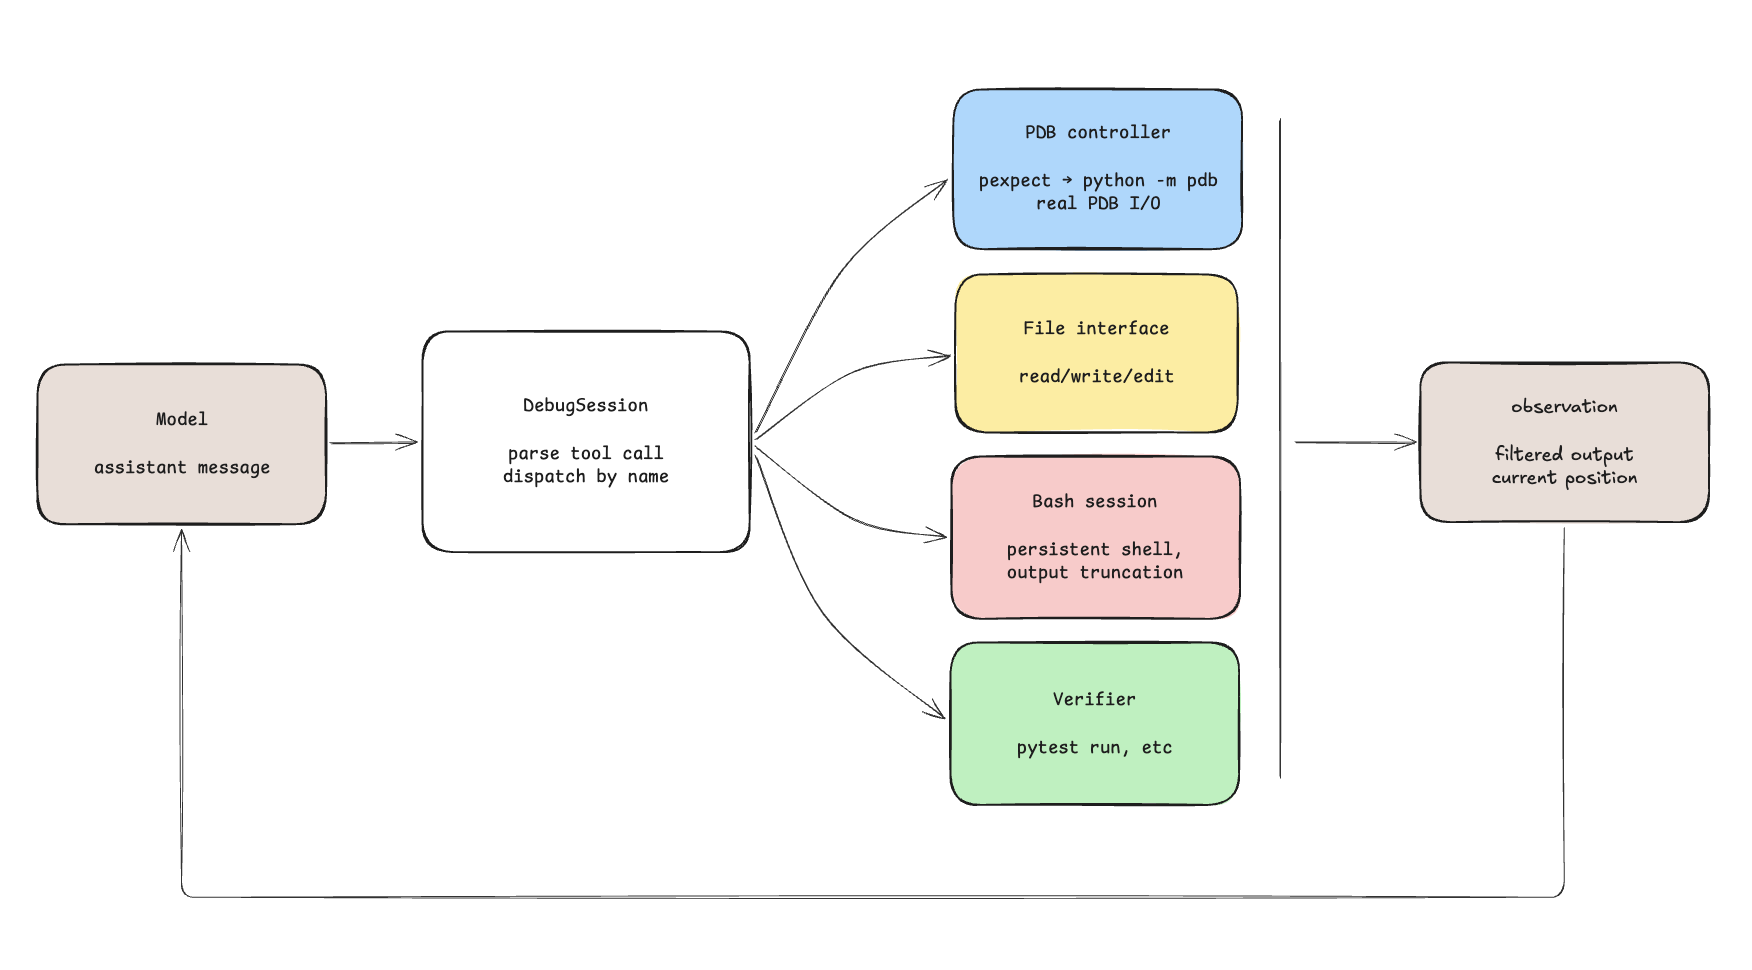
Figure 8: A debugging episode is a stateful turn loop. The model does not talk to pdb, bash, or the filesystem directly; it talks to DebugSession, which returns normalized observations.
In pseudocode, the outer loop looks like this:
1workspace = materialize_task(task)
2session = DebugSession(workspace)
3trajectory = []
4
5for turn in range(max_turns):
6    message = model.generate(prompt, trajectory)
7    tool_call = parse_tool_call(message)
8    observation = session.dispatch(tool_call)
9
10    trajectory.append({
11        "assistant": message,
12        "tool_call": tool_call,
13        "observation": observation,
14    })
15
16    if session.should_verify(tool_call):
17        return run_independent_pytest(workspace)
18
19return verify_if_recent_edit(workspace, trajectory)
That loop is shared across baseline evals, synthetic trajectory generation, SFT data collection, and RL, so tool behavior learned during training matches eval.
The harness had four jobs:
- isolate every task in a fresh sandbox,
- expose a small, consistent tool interface,
- normalize noisy terminal/debugger output into model-readable observations,
- verify success outside the model's own claim.
DebugSession as the Router
The tool surface:
1pdb_tools = {
2    "start_debugger", "add_breakpoint", "continue_execution",
3    "step_over", "step_into", "print_variable", "examine_locals",
4    "examine_globals", "run_expression", "list_code", "where_am_i",
5}
6bash_tools = {"bash"}
7file_tools = {"edit_file", "write_file"}
8control_tools = {"done"}
DebugSession is the daemon-side router. It holds no debugging logic; it maps each tool name to the component that owns the relevant state:
1def dispatch(self, tool_name: str, arguments: dict) -> str:
2    if tool_name in pdb_tools:
3        return self.pdb.call(tool_name, arguments)
4    if tool_name in bash_tools:
5        return self.shell.run(arguments["command"])
6    if tool_name in file_tools:
7        return self.files.call(tool_name, arguments)
8    if tool_name in control_tools:
9        return self.control.call(tool_name, arguments)
10    return f"Error: unknown tool {tool_name}"
The evaluator uses the same tool schema for local vLLM models and remote API models, but it does not trust provider-native tool calling alone. If a model emits the training-time XML format, the evaluator parses it back into OpenAI-style tool calls:
1<tool_call>
2{"name": "tool_name", "arguments": {...}}
3</tool_call>
The router also makes the trace auditable. Scoring a trajectory reduces to structured checks against the call log: whether the debugger was opened, whether locals were inspected after a breakpoint, whether an edit followed a runtime observation, and whether the final verifier passed. None of this is recoverable if the model can run an uninstrumented debugger from inside a shell.
PDB Controller
The PDB subsystem drives a real python -m pdb or pytest --trace subprocess through pexpect. It chooses the launch command based on whether the model starts from a test file or a source file:
1if self._is_test_file():
2    cmd = (
3        f"{sys.executable} -u -m pytest --trace {self.existing_file_path}"
4        f" -x -s --tb=short --no-header -q"
5    )
6else:
7    cmd = f"{sys.executable} -u -m pdb {self.existing_file_path}"
8
9self.child = pexpect.spawn(cmd, encoding="utf-8", codec_errors="replace",
10                           cwd=os.path.dirname(self.existing_file_path) or ".",
11                           timeout=10)
If you launch plain python -m pdb on a test file, the test functions are never called: they are module-level defs that pytest needs to discover and invoke. Breakpoints the model sets in library code would never fire, leading the model to infer the bug was in unreachable code. Running through pytest --trace makes pytest actually execute the test, so breakpoints land on the real call path. The harness also detects the failure mode where the program runs to completion without hitting any breakpoint and rewrites the message into an actionable hint: "Program finished without hitting any breakpoint. Restarted at <file>:<line>. Hint: if you are debugging a library file, start the debugger on the TEST file instead so the function is actually called." That hint helped with a recurring loop where models would set a breakpoint, see no hit, set another, and never re-target.
The controller turns high-level tool calls into ordinary PDB commands. For example:
| Model tool | PDB command | Debugger action |
|---|---|---|
add_breakpoint({"file": "x.py", "lines": [42]}) | b x.py:42 | Set breakpoint |
continue_execution() | c | Continue to next breakpoint |
step_over() / step_into() | n / s | Step over / into |
examine_locals() | p locals() plus filtering | Inspect current frame |
where_am_i() | where plus current-position parsing | Report stack and execution point |
The model-facing names are not PDB syntax. They describe debugger actions that also exist in other runtimes: set a breakpoint, continue, step, inspect a frame, report the current position. The same approach can extend to other debugger runtimes like gdb.
Small errors are rewritten into recoverable observations. A blank or comment-only breakpoint, for example, returns:
1Error: Cannot set breakpoint at line 61 in test_file.py because it is blank/comment-only.
2Pick an executable line (e.g., an assert or a function call).
Raw PDB says only *** Blank or comment. That is enough for a human who already knows the debugger, but it is not a useful training signal for a model.
Observation Filtering
The model never sees raw pdb output. Every debugger response is cleaned before it goes back into the conversation: prompts and stray execution markers are stripped, __builtins__ dumps collapse to <filtered>, Python startup noise and builtin class listings are removed, dunder keys like __name__ / __loader__ / __spec__ are dropped, individual variable representations are capped at 200 chars, total output is capped at 4 KB, and a single examine_locals is capped at 30 entries.
The raw and filtered outputs differ by thousands of low-value tokens. A single examine_locals at module scope looks like this before filtering:
1{'__name__': '__main__',
2 '__doc__': None,
3 '__package__': None,
4 '__loader__': <_frozen_importlib_external.SourceFileLoader object at 0x10a1f2c50>,
5 '__spec__': None,
6 '__file__': '<module file>',
7 '__builtins__': {'__name__': 'builtins',
8                  '__doc__': "Built-in functions, exceptions, and other objects.\n\nNoteworthy: ...",
9                  'False': False, 'None': None, 'True': True,
10                  'ArithmeticError': <class 'ArithmeticError'>,
11                  'AssertionError': <class 'AssertionError'>,
12                  'AttributeError': <class 'AttributeError'>,
13                  ... 150 more entries ...
14                  'abs': <built-in function abs>,
15                  'all': <built-in function all>,
16                  ... },
17 'Cache': <class '__main__.Cache'>,
18 'cache': <Cache size=3 hits=0 misses=0>,
19 'key': 'user:42',
20 'value': {'name': 'alice', 'role': 'admin'}}
21(Pdb)
After filtering, the model sees the variables relevant to the current frame:
1{'Cache': <class '__main__.Cache'>,
2 'cache': <Cache size=3 hits=0 misses=0>,
3 'key': 'user:42',
4 'value': {'name': 'alice', 'role': 'admin'}}
Anything truncated comes back wrapped in <OUTPUT_TRUNCATED remaining_bytes=… sha1=…> so the model knows the response is incomplete. Across step_over, step_into, continue, and breakpoint hits, every response also updates a shared current_position = (file, line) cursor parsed from the PDB execution-point line, so the model always sees a normalized execution point regardless of which command produced it. The policy should learn from state transitions, not from accidental formatting artifacts in a terminal session.
Irrelevant tokens are not free for a model: they consume context budget and become inputs the policy can condition on. The output contract keeps frame state stable across calls:
1<execution_position file="buggy_module.py" line=6>
2locals:
3  node = Node(name="team", allow=False)
4  chain = [Node("org"), Node("team"), Node("project")]
5  inherited = True
6</execution_position>
Bash Session
The bash tool is a single persistent shell, not one subprocess per command, so cd, exports, and shell history carry across calls the way they would in a real session.
A PTY, or pseudo-terminal, makes the shell behave as if it were attached to an interactive terminal rather than plain pipes. That matters because bash then emits prompts and handles interactive state normally.
The harness pairs the PTY with a UUID-tagged custom prompt and an injected exit-code marker after every command, so command completion and exit codes are detected deterministically:
1cmd_one_line = " ; ".join(
2    part.strip() for part in command.splitlines() if part.strip()
3)
4wrapped = (
5    f"{{ {cmd_one_line} ; }}; "
6    "__BASH_EC=$?; "
7    f"echo \"{self._exit_code_token}$__BASH_EC\""
8)
9self._send(wrapped + "\n")
10output = self._read_until_prompt()
A few implementation details worth highlighting:
-
Multi-line command collapsing. Commands are collapsed onto a single line with
;so bash only prints one prompt for the whole payload. Without this, the PTY reader can stop early on an intermediate prompt and return partial output. -
UUID-tagged exit codes. The exit-code marker is a UUID-tagged token (
__BASH_EXIT_CODE_<uuid>__:$?), not a fixed string, so the model can't fake an exit code by echoing the marker in its own output. -
Output truncation. Output is capped at 100 lines / 8 KB. Truncated responses come back wrapped in
<TOOL_OUTPUT_TRUNCATED command="…" lines=… bytes=… sha1=…>, mirroring the PDB truncation envelope so the truncation signal is uniform across tools. -
Blocked direct pdb access. The harness blocks direct
pdbuse through bash, so debugger interaction has to go through the instrumented debugger tools. Without this, the model could bypass the instrumented tools entirely and leave no structured trace for evaluation.
The shell covers the parts of repair that are not interactive debugging: reading file windows with sed, grepping for definitions, running focused tests, and verifying the final patch before done.
File Interface
The file interface is minimal. edit_file does exact-string substitution, not fuzzy matching or unified-diff parsing, and returns the number of occurrences replaced:
1content = full_path.read_text(encoding=self.ENCODING)
2
3if old_string not in content:
4    return f"Error: String not found in {file_path}"
5
6count = content.count(old_string)
7new_content = content.replace(old_string, new_string)
8full_path.write_text(new_content, encoding=self.ENCODING)
9return f"Successfully replaced {count} occurrence(s) in {file_path}"
The other write path is write_file, which creates or overwrites a file from explicit content:
1full_path.write_text(content, encoding=self.ENCODING)
2return f"Successfully wrote {len(content)} characters to {file_path}"
That keeps both edit modes explicit: replace a known snippet, or write the whole file. Exact replacement eliminates ambiguity around which match the model meant and surfaces "string not found" as a hard error the model has to react to instead of silently no-op'ing.
Test files are protected at workspace/container setup time: the materialized workspace records them as protected paths, and the container permission setup makes those files read-only. Without that guard, a model under turn pressure can satisfy the verifier by relaxing the assertion (assert x == 5 → assert x == 4) rather than fixing the bug.
Independent Verification
Completion is verified outside the model's claim. When the model calls done, the evaluator re-runs python3 -m pytest . -v inside the container and marks the trajectory successful only if that independent verification passes. If the turn budget is exhausted, it only runs that final verification if the model made a recent edit. So success is structurally enforced by the harness, not left as a prompt convention.
RL needs this because the reward has to come from the verifier, not the model's done call. It is also what lets the synthetic data pipeline filter for good trajectories.
Sandboxing
Each episode gets a fresh workspace, so stale breakpoints, modified files, dependency installs, shell state, and generated caches cannot leak between tasks. The sandbox also lets the verifier remain simple: after done is called, the evaluator runs the test command in the same isolated environment, with no risk of contamination from prior tasks.
Part 3 will cover the performance considerations and optimizations needed to make this sandboxing performant during RL.
Dataset
The dataset had two requirements:
- Define executable bug-fixing environments for RL and for generating synthetic trajectories.
- Provide supervised traces for the debugger behaviors the policy should learn.
I built it in stages, starting from validated bug tasks and then turning those tasks into full synthetic debugging trajectories and shorter microskill traces.
Why Not Use an Existing Benchmark?
I looked at the standard repair benchmarks first. They mostly test whether a model can fix a bug, not whether runtime inspection produced the fix. For this project, that distinction matters. If a model can solve the task by reading the failing assertion and changing one local line, the task does not measure debugger use.
| Benchmark | What it provides | Why it is not useful here |
|---|---|---|
| SWE-bench / SWE-bench Verified6 | Repository-level GitHub issues | Tests issue resolution end-to-end; runtime inspection is one of many possible strategies, never isolated |
| BugsInPy7 | Real Python bugs from open-source projects | Many instances are localizable from source + failing tests alone |
| Defects4J8 / Defects4C9 | Real Java / C / C++ defects | Many instances still emphasize source-level repair over isolated runtime-state use |
| QuixBugs10 | Compact algorithmic repair tasks | Single-file, often small local changes; little runtime state to inspect |
| DebugBench11 | Targets debugging directly | Instances are LeetCode-style; many can be localized from source + failing tests |
If source inspection and a failing test are enough to find the bug, training on those tasks just reinforces better static reasoning. I needed multi-file, state-dependent failures where breakpoints, stack frames, and local variables expose information the source code doesn't. The benchmark therefore had to make runtime state useful without making the task impossible to solve by other means.
Building the Dataset
The data pipeline had two separate outputs: the bug-fixing environments, and the behavior traces the model would imitate. Separating them avoids a common failure mode in synthetic-data pipelines, where well-formatted trajectories are generated over poorly specified tasks.
-
Curated bug tasks: executable debugging problems with a buggy implementation, tests, metadata, and a heldout correct solution. These define the environment: what files the model can see, what tests fail, and what counts as a valid fix.
-
Synthetic trajectories: full or partial agent rollouts showing the target workflow. These traces teach the behavior around the tasks: read before editing, form a hypothesis, enter the debugger when runtime state is useful, set targeted breakpoints, inspect locals or stack frames, make a focused patch, and verify with tests.

Figure 9: Data pipeline from validated bug tasks to debugger rollouts and microskill traces.
Stage 1: Bug Task Construction
The first step was to build debugging tasks that required investigation, not just static pattern matching. Each task had to require the full repair loop: inspect the files, reproduce the failure, identify the fault, edit the implementation, and verify the fix.
Task Design Process
I started by writing bug tasks manually to settle the format and failure type.
I rejected tasks where the fix was an obvious one-line edit. In accepted tasks, the buggy code was embedded in otherwise correct logic, so the model had to trace the execution path before it could identify the faulty state transition. I also filtered for fast-running examples, since each task would be executed many times during data generation and evaluation.
When a problem turned out to be too easy to solve from source text and failing assertions alone, I rewrote or replaced it with one that depended more on runtime state: object identity, frame-local values, ordering, recursion depth, ownership, or timeout behavior.
Task Format and Example
Each task has a buggy implementation, a correct implementation, optional shared files, a shared pytest suite, and metadata. The model only sees the buggy working set and the tests. The correct version is held back for validation, leakage checks, and solution-similarity scoring.
1import os
2import sys
3import threading
4import time
5
6sys.path.append(os.path.dirname(__file__))
7
8from resource import SharedResource
9from callback import CallbackChain, WorkItem
10
11
12class ReentrantLock:
13    def __init__(self):
14        self._lock = threading.Lock()
15        self._owner = None
16        self._count = 0
17        self._condition = threading.Condition(threading.Lock())
18
19    def acquire(self, timeout=None):
20        me = threading.current_thread().ident
21        deadline = None if timeout is None else time.monotonic() + timeout
22
23        with self._condition:
24            if self._owner == me:
25                self._count += 1
26                return True
27
28            while self._owner is not None:
29                if deadline is not None:
30                    remaining = deadline - time.monotonic()
31                    if remaining <= 0:
32                        return False
33                    self._condition.wait(timeout=remaining)
34                else:
35                    self._condition.wait()
36
37            self._owner = threading.current_thread()
38            self._count = 1
39            return True
40
41    def release(self):
42        with self._condition:
43            self._count -= 1
44            if self._count == 0:
45                self._owner = None
46                self._condition.notify()
47
48
49class ResourceGuard:
50    def __init__(self, resource=None):
51        self.resource = resource or SharedResource()
52        self._lock = ReentrantLock()
53
54    def read(self, key, timeout=None):
55        if not self._lock.acquire(timeout=timeout):
56            raise TimeoutError(f"Could not acquire lock for read({key})")
57        try:
58            return self.resource.read(key)
59        finally:
60            self._lock.release()
61
62    def write(self, key, value, timeout=None):
63        if not self._lock.acquire(timeout=timeout):
64            raise TimeoutError(f"Could not acquire lock for write({key})")
65        try:
66            self.resource.write(key, value)
67        finally:
68            self._lock.release()
69
70    def read_then_write(self, key, transform, timeout=None):
71        if not self._lock.acquire(timeout=timeout):
72            raise TimeoutError(f"Could not acquire lock for read_then_write({key})")
73        try:
74            current = self.read(key, timeout=timeout)
75            new_val = transform(current)
76            self.write(key, new_val, timeout=timeout)
77            return new_val
78        finally:
79            self._lock.release()
80
81
82class LockManager:
83    def __init__(self):
84        self._guards = {}
85
86    def get_guard(self, name):
87        if name not in self._guards:
88            self._guards[name] = ResourceGuard()
89        return self._guards[name]
A representative multi-file bug task, reentrant_lock_owner_confusion: the broken lock implementation, supporting resource and callback modules, a shared test file, and metadata marking debugger use as recommended.
The example above follows the same paired structure as the rest of the corpus:
- incorrect code,
- optional shared source files,
- correct code,
- a
pytestsuite, - and a metadata file containing a human-labeled intended debugger preference.
The test harness is designed so the exact same target test file can run against either implementation:
1if pytest.use_correct:
2    from lock_manager_correct import LockManager, ResourceGuard
3else:
4    from lock_manager import LockManager, ResourceGuard
This made each task a self-contained bundle with paired buggy and fixed implementations under one shared test harness. A small validation flag selected which implementation the tests imported.
This branching logic is stripped out when files are materialized inside the agent container. Filenames are normalized too: buggy implementations get ordinary module names, task-specific test files get a generic test name, comments that mark the bug are stripped, and fixed implementations are not copied unless a validator explicitly asks for them. The model only sees the buggy working set, shared support files, and normal tests. It never sees the import shim or the fixed implementation.
This task has the properties the corpus targets. The code is runtime-valid and locally plausible; the bug becomes apparent only after comparing the runtime value stored as the lock owner against the value used by the re-entrancy condition.
1def acquire(self, timeout=None):
2    me = threading.current_thread().ident
3
4    with self._condition:
5        if self._owner == me:
6            self._count += 1
7            return True
8
9        ...
10
11        self._owner = threading.current_thread()
12        self._count = 1
13        return True
The re-entrancy check compares thread.ident against self._owner, but self._owner is a Thread object rather than an identifier. Nested access therefore stops being re-entrant, and the failure surfaces as a timeout or deadlock with no assertion identifying the type mismatch. Inspecting the two values at the breakpoint reduces the diagnosis to a concrete local invariant: self._owner and me represent the same concept with different types.
For the benchmark itself, I only kept tasks with a simple executable guarantee: in isolated workspaces, the buggy version must fail and the heldout correct version must pass. Some tasks also carry a dependency manifest; those dependencies are installed into the isolated workspace before pytest or pdb runs, so vendored-library and serialization-state failures can be evaluated without giving the model network access from inside the container.
At the frozen benchmark point, the active corpus had 182 validated bug tasks, split into 104 train, 38 validation, and 40 heldout. Splits are sticky: old assignments are preserved, and only new tasks get hashed into split membership. The heldout set is the real test set, and the training pipeline checks that heldout tasks do not enter SFT or RL sampling.
Each task also had a human debugger-preference label (recommended, optional, or avoid) so I could measure calibration, not just capability. The target is to use the debugger when runtime state is likely to reduce uncertainty, not to use it on every task.
Corpus Shape
The 182 finalized tasks span a wide range of sizes. Most are small (median 138 LOC across roughly 2 files, with tests counted), but a long tail of multi-file tasks pushes past 500 LOC. In those, the bug sits in one module of a larger codebase, and localizing it means working across files and call stacks. The dependency-manifest tasks push on a different axis: the failure lives inside an installed third-party library, so reaching it means stepping into that code. Those packages are not in the LOC counts below, which only measure each task's own source.
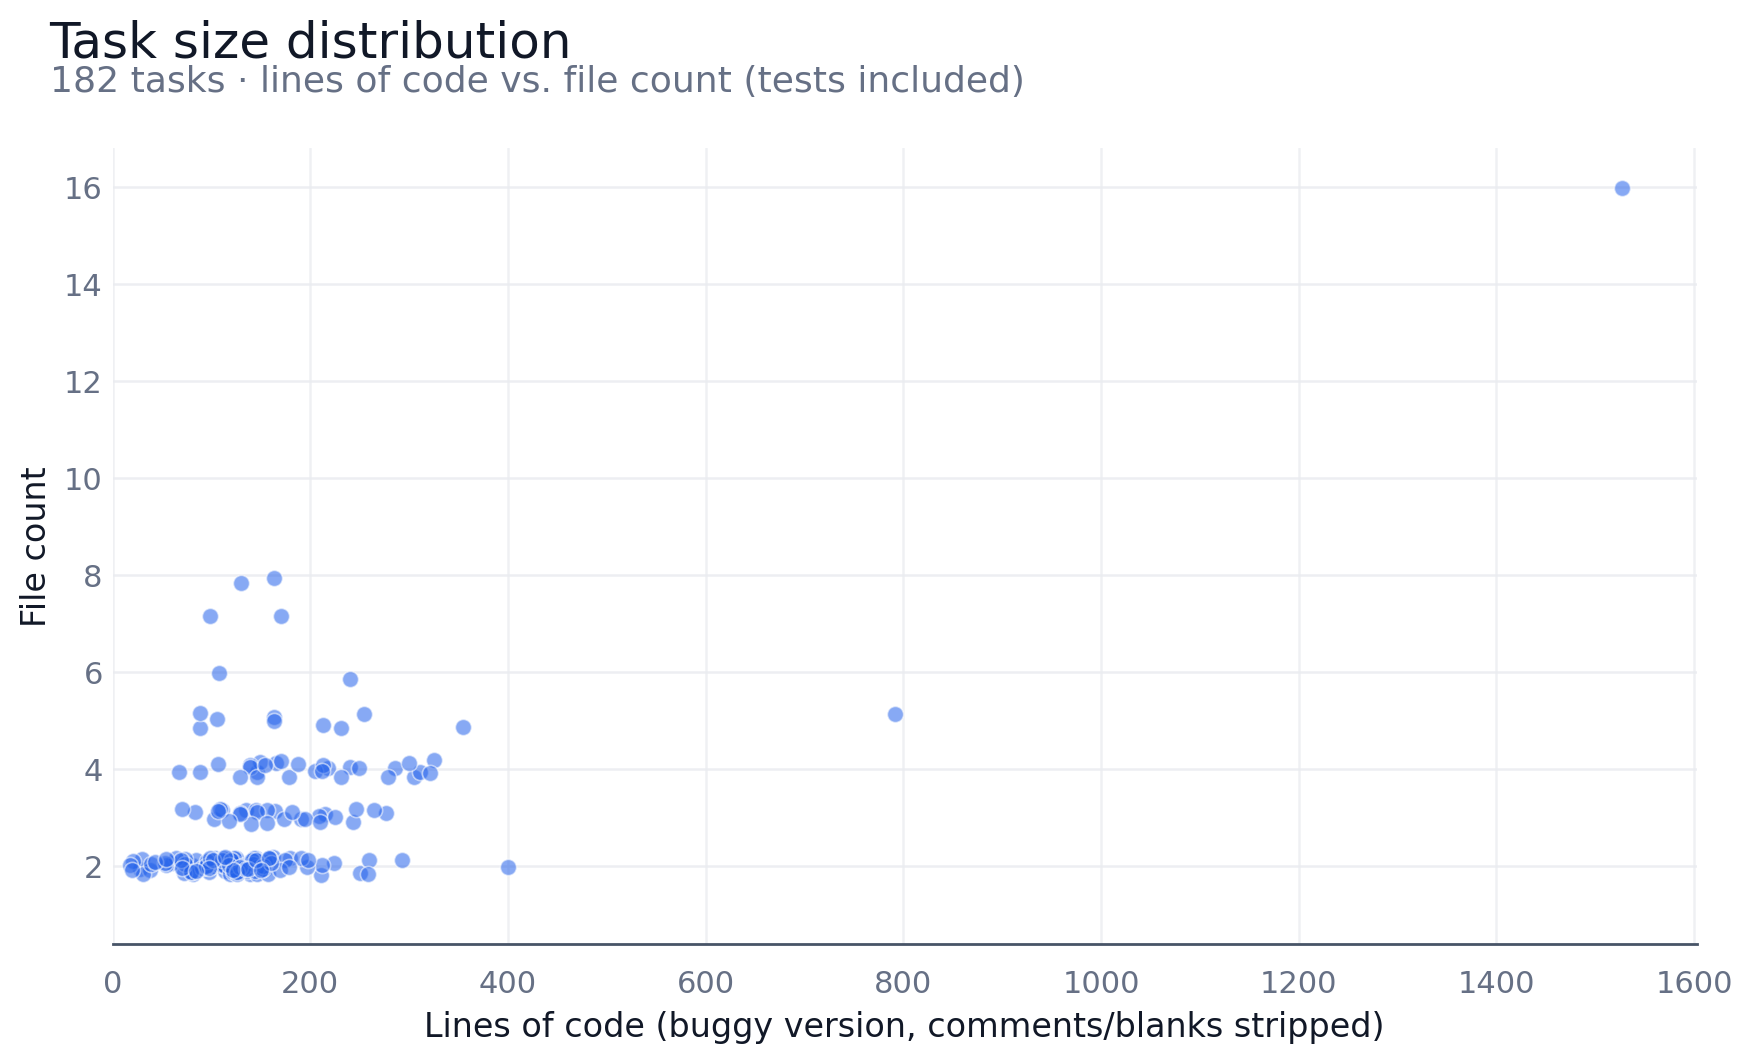
Figure 10: Corpus size by lines of code and file count across 182 bug tasks.
The fix itself is usually much smaller than the surrounding code. The median diff between the buggy and fixed implementation is only 11 lines, and 90% of tasks change fewer than 50 lines, consistent with the design goal that the bug should sit inside mostly-correct code, not be a wholesale rewrite.
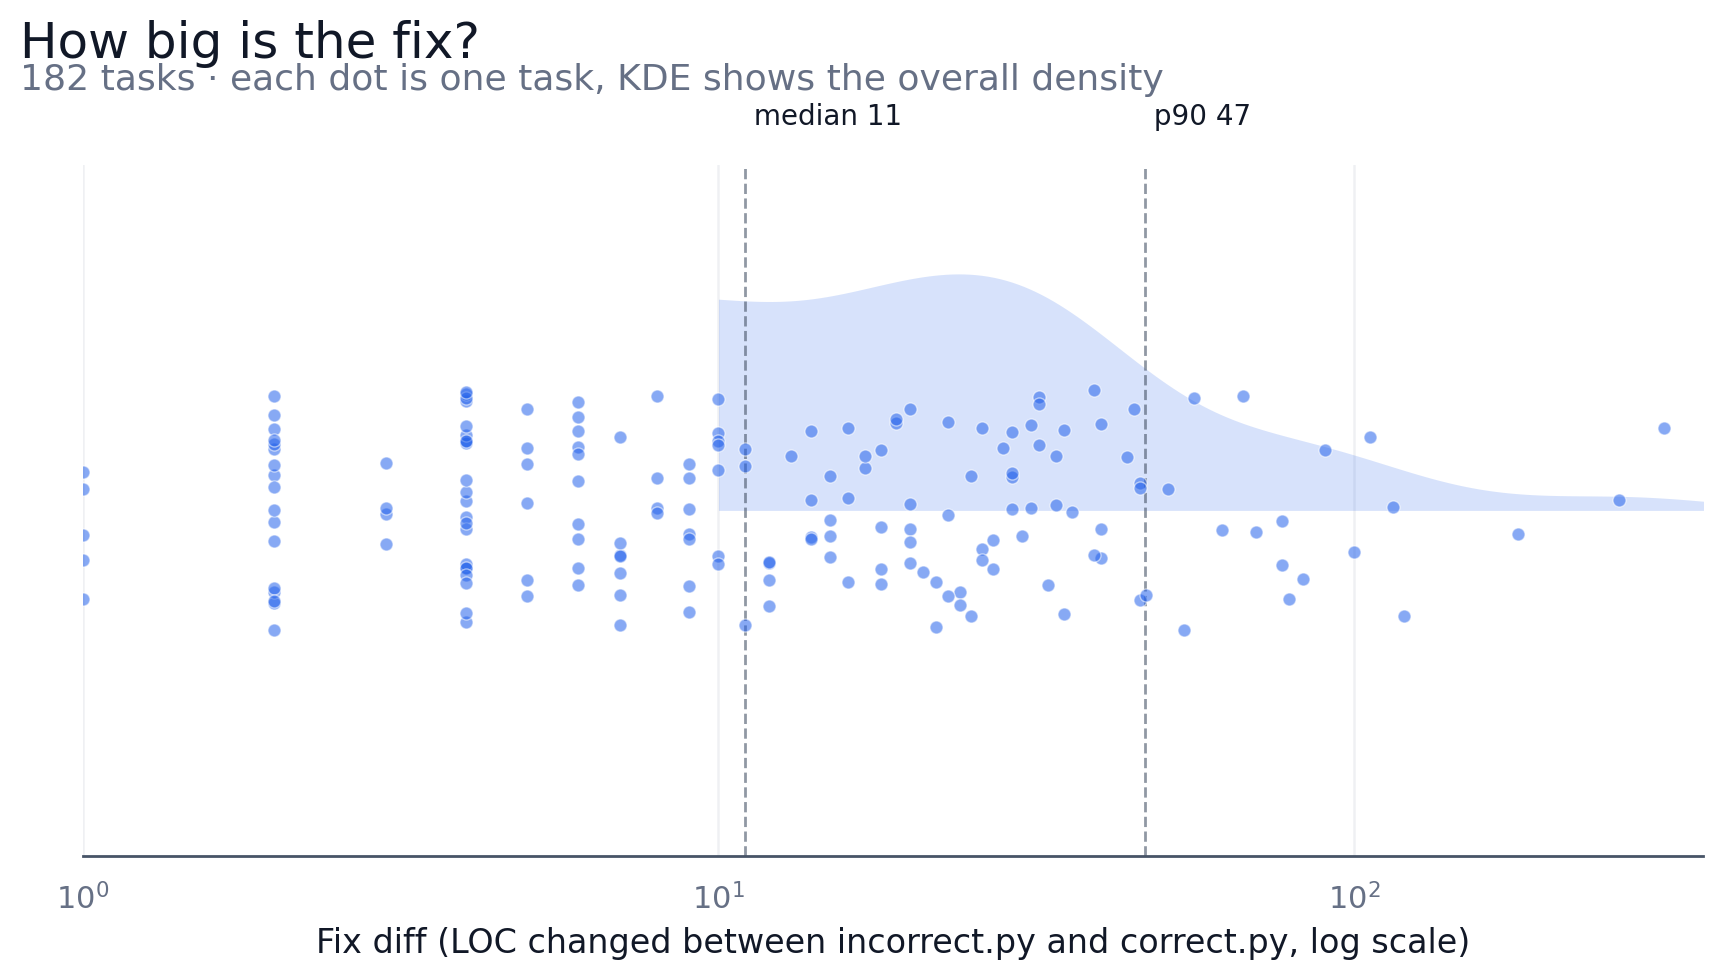
Figure 11: Distribution of fix-diff length across the 182 bug tasks.
Stage 2: Synthetic Rollouts
A bug task benchmark is not enough for SFT. I also needed full trajectories showing what good debugger-using behavior looks like inside the same harness the model would later train and evaluate in. The catch is that a passing trajectory is not necessarily a good training example.
I generated two kinds of trajectories:
- Full trajectories that solve bugs through the debugger workflow.
- Microskill trajectories showcasing isolated habits.
Full trajectories are complete bug-fix episodes. The goal was to collect repairs whose intermediate evidence was worth imitating, not arbitrary trajectories that pass tests.
Workflow Constraints
The harness forces the agent to interact through explicit tool calls. During trajectory generation, I used the prompt and runtime checks to push the generator toward an interactive debugger workflow rather than ad hoc print-debugging or speculative editing.
The desired trace shape, side by side with the actual tool calls:
1T1   bash:               sed -n '1,80p' suspect_file.py    # read before editing
2T2   (reasoning)                                           # form a concrete hypothesis
3T3   start_debugger:     test_file.py                      # only when runtime state matters
4T4   add_breakpoint:     suspect_file.py:42                # targeted, not blanket
5T5   continue_execution                                    # advance to the breakpoint
6T6   examine_locals                                        # inspection adjacent to evidence
7T7   edit_file:          suspect_file.py                   # focused patch
8T8   bash:               pytest -xvs test_file.py          # verify before done
9T9   done                                                  # only after a passing run
Both the GPT-5.4 and Qwen trajectories above violate this shape: breakpoints placed without a supporting hypothesis, inspections that do not inform the patch, done reached without verification. The synthetic data pipeline's job was to produce traces that do not violate it.
Teacher Model Selection
For trajectory generation, I used MiniMax M2.5. I initially tried Kimi 2.6, but MiniMax M2.5 produced more reliable passing trajectories under the same harness and filtering policy, so it became the default generator model.
The relevant part of the system prompt used during synthetic trajectory generation:
1You are an expert Python debugger who specializes in interactive debugging techniques and systematic problem-solving.
2
3CRITICAL DEBUGGER WORKFLOW:
4Use the interactive debugger to understand runtime behavior. Each step is one turn with ONE tool call:
5
61. start_debugger - Launch the debugger
72. add_breakpoint - Set breakpoints at strategic locations
83. continue_execution - Run to the breakpoint
94. Inspect - Use print_variable, examine_locals, or run_expression
105. Step - Use step_over or step_into to trace execution
116. Repeat steps 3-5 until you understand the root cause
12
13IMPORTANT:
14- Use interactive debugger tools (start_debugger, add_breakpoint, print_variable, etc.)
15- DO NOT create debug scripts or helper files - the debugger is more powerful
16- continue_execution RUNS the program to breakpoints - you can't inspect without it
17- NEVER modify test files - only fix the buggy source code files
18
19FILE READING STRATEGY (CRITICAL):
201. Get metadata first: wc -l -c file
212. Use WINDOWED reads to avoid truncation:
22   - sed -n '1,80p' file (first 80 lines)
23   - sed -n '50,130p' file (lines 50-130)
243. NEVER use cat, head, tail without limits (WILL truncate)
254. If <TOOL_OUTPUT_TRUNCATED>: adjust window to read different section
26
27Remember: The debugger reveals what's ACTUALLY happening - use it to discover the truth!
I also conditioned the generator to use the context window efficiently. Traces were required to start with cheap metadata probes like wc -l -c ... && sha1sum ... and then read files in bounded windows rather than dumping them whole.
Runtime Enforcement and Scoring
The runtime layer reinforced the same discipline. For example, it rejected debugger-only actions unless the model had already started a session:
1if tool_calls and not state.debugger_started:
2    tool_name = tool_calls[0].name
3    if tool_name in DEBUGGING_TOOLS and tool_name != "start_debugger":
4        raise self.ToolCallParsingError(
5            f"Tool '{tool_name}' requires start_debugger to be called first. "
6            f"Call start_debugger first, then you can use {tool_name}."
7        )
Generation was best-of-N rather than single-shot. For each task, I sampled up to four candidate trajectories, executed them in the same harness used for training and eval, scored them with a shared pdb_policy_v1, and kept the highest-scoring passing trace. Passing the tests was necessary, but not sufficient: a trace could be functionally correct while teaching the behavior the baseline had just shown to be ineffective.
1attempts = max(1, int(options.max_quality_retries) + 1)
2
3for attempt_idx in range(1, attempts + 1):
4    messages, tests_passed = await step_generator.generate_debugging_conversation(task)
5    eval_result = _evaluate_quality(messages, tests_passed, preference, options)
6
7    candidate = {
8        "messages": messages,
9        "tests_passed": tests_passed,
10        "attempt_idx": attempt_idx,
11        "quality": eval_result,
12    }
The policy is strict because the SFT target is behavioral, not just functional:
1{
2  "min_quality_score": 0.7,
3  "enforce_preference": true,
4  "require_recommended_inspection": true,
5  "require_recommended_flow_inspect_adjacency": true,
6  "enforce_done_after_verification": true
7}
Post-Processing and Filtering
After generation, I ran a second post-processing pass to convert raw synthetic trajectories into SFT data. This pass treats each conversation as an ordered sequence of actions to validate, not a transcript judged solely by its final test result.
The policy filter rejected traces with invalid tool ordering, blind stepping, repetitive loops, edits without a prior read, debugger use that did not inform the edit, or done before verification. It also enforced the debugger-preference label on the task: recommended examples had to inspect state near the execution flow, while avoid examples had to skip the debugger entirely.
1eval_result = evaluate_messages_policy(
2    messages,
3    policy_config=options.policy_config,
4    preference=pref,
5    tests_passed=tests_passed,
6)
7
8passed = (
9    len(hard_reasons) == 0
10    and score >= float(options.min_quality_score)
11)
The saved trajectory includes the conversation plus quality metadata: the score, policy version, debugger preference, preferred debugger tools, and which generation attempt produced the accepted trace.
After filtering, the accepted SFT-side examples had the target properties:
- recommended examples had 100% inspection adjacency under the
pdb_policy_v1checker, - avoid examples had 100% debugger abstention compliance under the same checker,
- the traces were not padded with low-value debugger actions: auxiliary debugger tools made up just 2.18% of debugger tool calls in the accepted corpus.
Stage 3: Microskill Rollouts
Full bug-fix trajectories bundle many behaviors together. I added a second generator for short, focused microskills: read before edit, hit a breakpoint and inspect immediately, rerun pytest before done, recover when an edit tool fails. These examples have tighter turn budgets and explicit tool-level success criteria.
1@dataclass
2class MicroSkill:
3    name: str
4    description: str
5    instruction_template: str
6    max_turns: int
7    skill_level: str = "atomic"
8    skill_chain: List[str] = field(default_factory=list)
9    required_tool_sequence: List[str] = field(default_factory=list)
10    requires_verification: bool = False
11    tool_allowlist: Optional[List[str]] = None
12    required_tools: Optional[Set[str]] = None
13    required_any_of: Optional[List[Set[str]]] = None
14    requires_strict_order: bool = False
15    requires_inspection_adjacency: bool = False
16
17ATOMIC_MICRO_SKILLS = [
18    MicroSkill(
19        name="debugger_discipline",
20        description="Set a breakpoint and inspect state",
21        instruction_template="Set a breakpoint at line {line_number} in `{filename}`...",
22        max_turns=6,
23        tool_allowlist=[
24            "start_debugger", "add_breakpoint", "continue_execution",
25            "examine_locals", "print_variable", "run_expression", "done",
26        ],
27        required_tools={"start_debugger", "add_breakpoint", "continue_execution"},
28        required_tool_sequence=["start_debugger", "add_breakpoint", "continue_execution"],
29        required_any_of=[INSPECTION_TOOLS],
30        requires_strict_order=True,
31        requires_inspection_adjacency=True,
32    ),
33]
The schema covers both atomic skills and composite chains, such as skill_chain=["debug", "edit", "verify"], so the evaluator can check phase ordering. Generation reuses the same conversation manager, and each candidate is accepted only if it satisfies the microskill rubric:
1async def generate_microskill_trajectory(...):
2    instruction = skill.instruction_template.format(
3        function_name=function_name,
4        filename=filename,
5        line_number=line_number,
6        test_filename=task_test_filename(task.name),
7    )
8
9    manager = MicroSkillConversationManager(
10        llm_provider=llm_provider,
11        micro_skill=skill,
12        task_instruction=instruction,
13        orchestrator=orchestrator,
14        max_turns=skill.max_turns,
15    )
16    messages, _ = await manager.generate_debugging_conversation(task)
17    return messages, True, None
18
19for task in task_pool:
20    function_name, line_number = _pick_buggy_function(functions, task, target_file)
21
22    for attempt in range(1, max_retries_per_example + 1):
23        messages, _, generation_error = await generate_microskill_trajectory(...)
24        metrics = evaluate_microskill(messages, skill, meta, policy_config=policy_cfg)
25
26        if metrics.get("completed"):
27            accepted_example = {
28                "messages": strip_generation_hints(messages),
29                "task_completed": True,
30                "metadata": meta,
31                "metrics": metrics,
32            }
33            with open(output_file, "a") as f:
34                f.write(json.dumps(accepted_example) + "\n")
35            break
Microskills run on the same bug task corpus and tool surface as the full trajectories. They are mixed into SFT at a controlled ratio so the model sees each core debugger behavior in isolation while still learning to compose them inside full episodes. They supplement full episodes rather than replace them, increasing the density of local behaviors that full episodes may only contain once or twice.
Those two outputs, full trajectories and microskills, became the supervised training corpus for the next stage. The same bug task benchmark then served a second role during RL: instead of supplying target traces, it became the environment where the policy had to debug training tasks online and earn reward from both final correctness and process quality.
The final SFT corpus came out to 269 examples across 125 tasks (229 train / 40 validation): full debugger-using episodes plus a handful of microskill traces, all filtered against the behavioral policy.
Conclusion
Part 1 leaves three pieces in place:
- a debugger harness shared across data generation, SFT, RL, and eval, so behavior transfers across stages;
- 182 validated bug tasks with paired buggy/fixed implementations and human debugger-preference labels;
- 269 SFT examples (229 train / 40 val): full debugger-using trajectories plus a few microskill traces, filtered against a behavioral policy rather than against the final test outcome alone.
The main result in Part 1 is negative: none of the four off-the-shelf models tested converts debugger access into a measurable improvement. The rest of the series asks whether that failure is trainable. Part 2 uses the same harness and dataset for supervised fine-tuning, setting up the policy and infrastructure used for RL. Part 3 then uses RL to optimize when debugger use is worth the cost.
References
Anthropic. "Introducing Claude Opus 4.7." 2026. The release links to the Claude Opus 4.7 system card and notes Anthropic's SWE-bench methodology caveats.
Xingdi Yuan, Morgane M. Moss, Charbel El Feghali, et al. "debug-gym: A Text-Based Environment for Interactive Debugging." arXiv:2503.21557, 2025.
Cursor. "Debug Mode."
Shunyu Yao, Jeffrey Zhao, Dian Yu, et al. "ReAct: Synergizing Reasoning and Acting in Language Models." arXiv:2210.03629, 2022.
John Yang, Carlos E. Jimenez, Alexander Wettig, et al. "SWE-agent: Agent-Computer Interfaces Enable Automated Software Engineering." arXiv:2405.15793, 2024.
Carlos E. Jimenez, John Yang, Alexander Wettig, et al. "SWE-bench: Can Language Models Resolve Real-World GitHub Issues?" arXiv:2310.06770, 2023.
Rohan Widyasari, Sheng Qin Sim, Camellia Lok, et al. "BugsInPy: A Database of Existing Bugs in Python Programs to Enable Controlled Testing and Debugging Studies." ESEC/FSE, 2020.
Rene Just, Darioush Jalali, and Michael D. Ernst. "Defects4J: A Database of Existing Faults to Enable Controlled Testing Studies for Java Programs." ISSTA, 2014.
Jian Wang, Xiaofei Xie, Qiang Hu, et al. "Defects4C: Benchmarking Large Language Model Repair Capability with C/C++ Bugs." ASE, 2025. arXiv:2510.11059.
Derrick Lin, James Koppel, Angela Chen, and Armando Solar-Lezama. "QuixBugs: A Multi-Lingual Program Repair Benchmark Set Based on the Quixey Challenge." SPLASH Companion, 2017.
Zhenyu Chen, Kui Liu, Qi Liu, et al. "DebugBench: Evaluating Debugging Capability of Large Language Models." arXiv:2401.04621, 2024.